 ar
ar bg
bg hr
hr cs
cs da
da nl
nl fi
fi fr
fr de
de el
el hi
hi it
it ko
ko no
no pl
pl pt
pt ro
ro ru
ru es
es sv
sv tl
tl iw
iw id
id lv
lv lt
lt sr
sr sk
sk sl
sl uk
uk vi
vi et
et hu
hu th
th tr
tr fa
fa ms
ms hy
hy ka
ka ur
ur bn
bn mn
mn ta
ta kk
kk uz
uz ku
ku
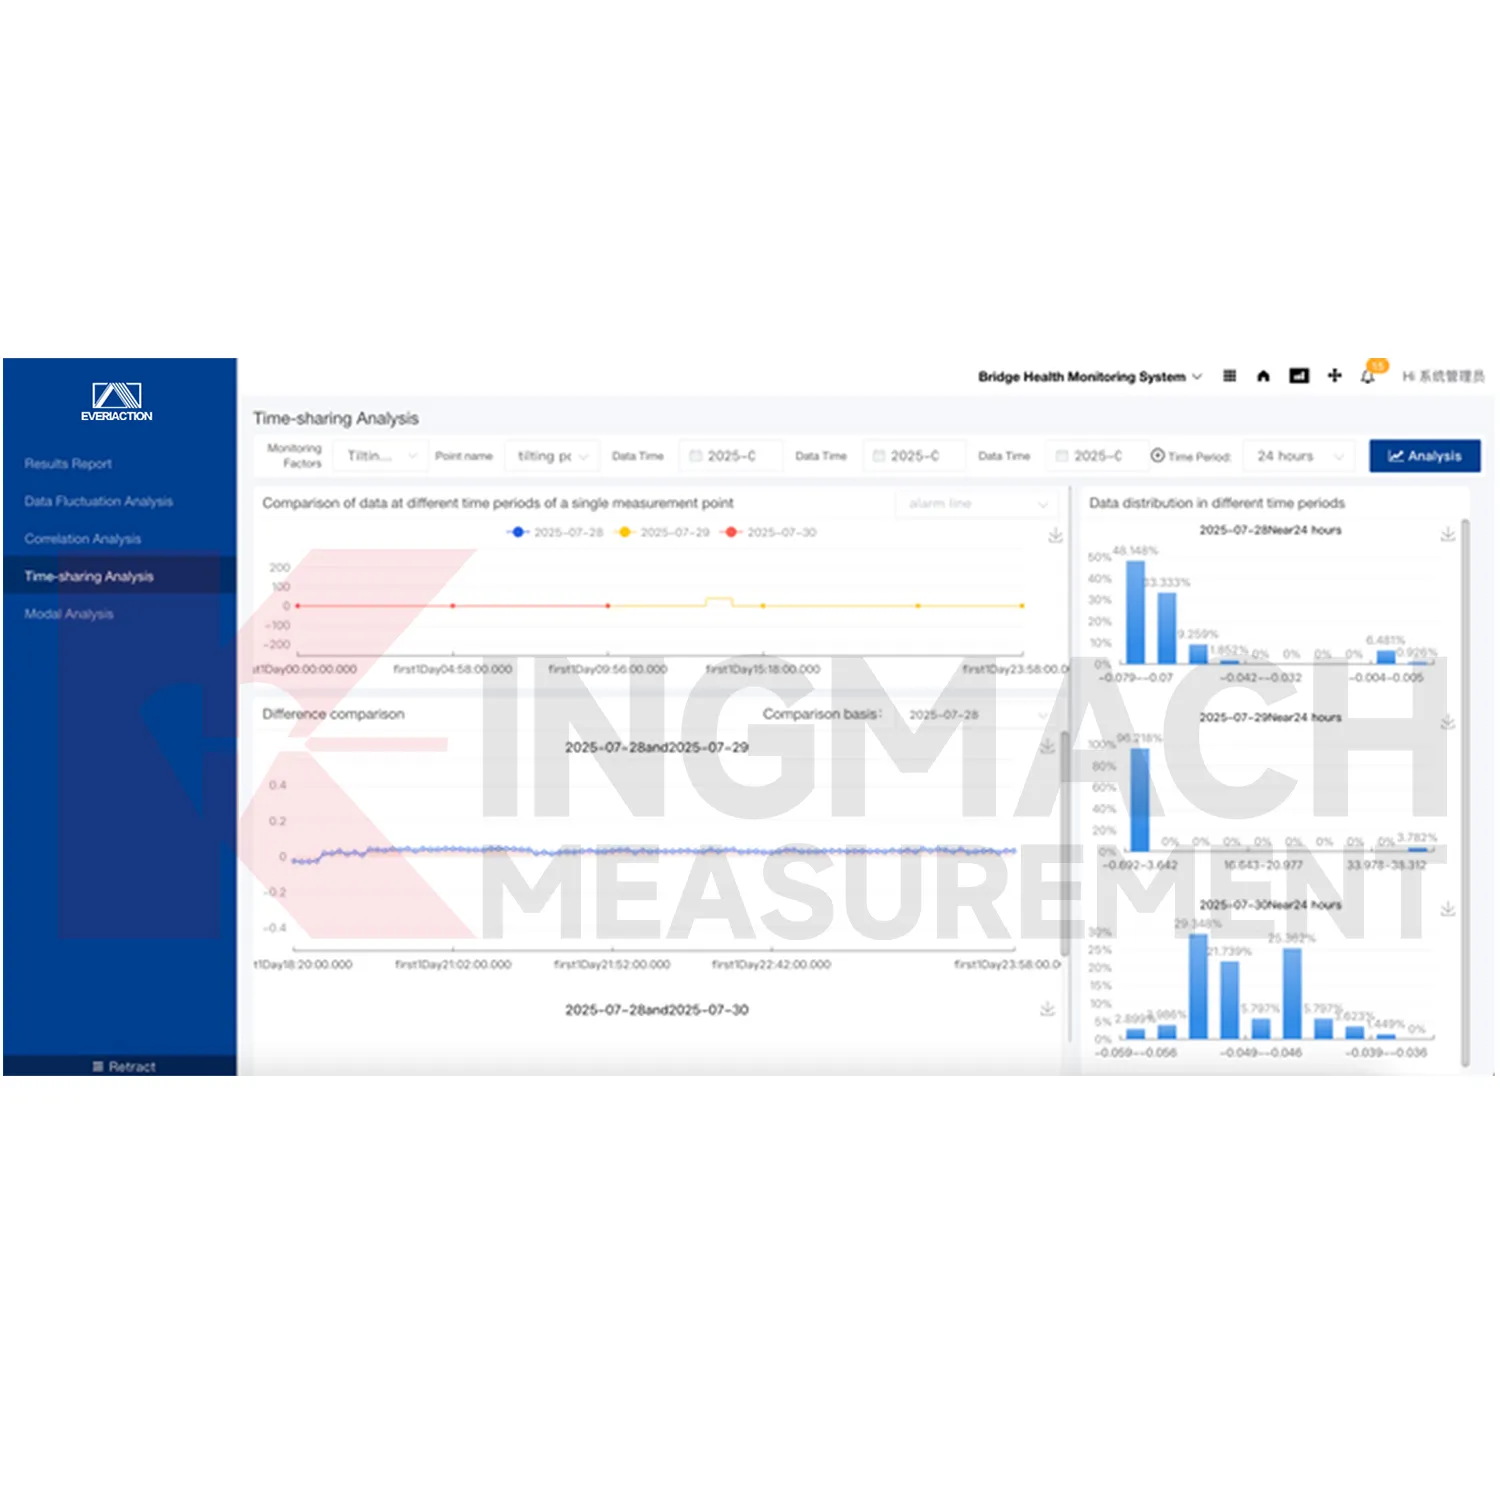
Data Acquisition
Kingmach Data Acquisition includes functions for fast storage, real-time filtering, efficient analysis, complex statistics, user-friendly display, and personalized customization of collected data. These functions help the user move from channel values to engineering understanding. Trend curves can show whether a point is stable, rising, falling, or reacting to weather and construction events. Filtering can reduce distractions before review. Custom display layouts help different users see the data they need for daily operation, risk review, or management reporting.
Application of Data Acquisition
Wind tower monitoring uses Kingmach Data Acquisition to combine tower tilt, vibration, foundation behavior, strain, wind, temperature, and maintenance records. A tower may respond differently under high wind, temperature change, operation state, and foundation conditions. The platform can visualize trends and preserve event history so reviewers can compare repeated behavior under similar conditions. Alarm configuration helps identify readings that need field inspection without treating every normal operating fluctuation as a fault.
The future of Data Acquisition
Cloud computing will support wider remote use of Kingmach Data Acquisition. Owners and engineering teams may need to review assets from offices, field sites, control centers, or mobile workstations. Cloud-based access helps keep monitoring visible even when the structure is difficult to reach. Remote review will not replace field verification, but it can improve timing. Teams can identify which area needs inspection, what related data should be checked, and which documents should be prepared before arriving on site.
Care & Maintenance of Data Acquisition
Alarm rules in Kingmach Data Acquisition should be reviewed by engineering staff, not copied blindly across every point. Different structures, sensors, and risk levels need different alarm logic. A settlement point, strain point, water-level point, and tilt point may require different thresholds, rate checks, and response procedures. After the first operating period, review alarm history and adjust rules where ordinary behavior is creating unnecessary alerts or where a critical pattern needs faster attention.
Kingmach Data Acquisition
Kingmach Data Acquisition also matters at handover, when the owner needs a platform that staff can operate after installation teams leave. The product page lists GB50982-2014 certification and instant delivery for the Monitoring system software platform. More importantly, the operating file should show project names, device access, account roles, alarm settings, display pages, report paths, and recent data quality. When those items are prepared clearly, the software does more than display readings; it gives the owner a repeatable daily routine for checking structural status and preserving evidence.
FAQ
Q: What certification is listed?
A: The product information lists GB50982-2014 certification.
Q: What is the minimum order quantity?
A: The local product page lists one piece as the minimum order quantity.
Q: What is the delivery time?
A: Delivery time is listed as instant for the software platform.
Q: How is pricing handled?
A: Pricing is listed as negotiable, so project scope, configuration, and integration needs should be confirmed with Kingmach.
Q: What payment term is shown?
A: The local product page lists T/T in advance.
Reviews
Michael Anderson
The strain gauges and load cells are extremely accurate and stable. They performed very well in our bridge monitoring project. Highly recommended!
David Wilson
We purchased displacement transducers and settlement sensors, and the quality exceeded our expectations. Easy installation and reliable performance.
Latest Inquiries
To protect the privacy of our buyers, only public service email domains like Gmail, Yahoo, and MSN will be displayed. Additionally, only a limited portion of the inquiry content will be shown.
Amelia***@gmail.comSingapore
Hello, I am looking for visualization software for monitoring system data analysis. Please let me kn...
Isabella***@gmail.comGermany
Hello, we are evaluating weir flow meters for a water management project. Please share accuracy deta...
Related product categories
- Web-based Monitoring Software
- Software Platform
- Data management software
- Monitoring Software Suite
- Monitoring system software platform
- Environmental Monitoring
- Visualization Software
- GPS Displacement Monitoring System
- Integrated Monitoring Station
- Settlement Monitoring Rod
- Structural Health Monitoring (SHM) System
- Structural Monitoring Cloud Platform