
 EN
EN
 ar
ar bg
bg hr
hr cs
cs da
da nl
nl fi
fi fr
fr de
de el
el hi
hi it
it ko
ko no
no pl
pl pt
pt ro
ro ru
ru es
es sv
sv tl
tl iw
iw id
id lv
lv lt
lt sr
sr sk
sk sl
sl uk
uk vi
vi et
et hu
hu th
th tr
tr fa
fa ms
ms hy
hy ka
ka ur
ur bn
bn mn
mn ta
ta kk
kk uz
uz ku
ku
Environmental Monitoring
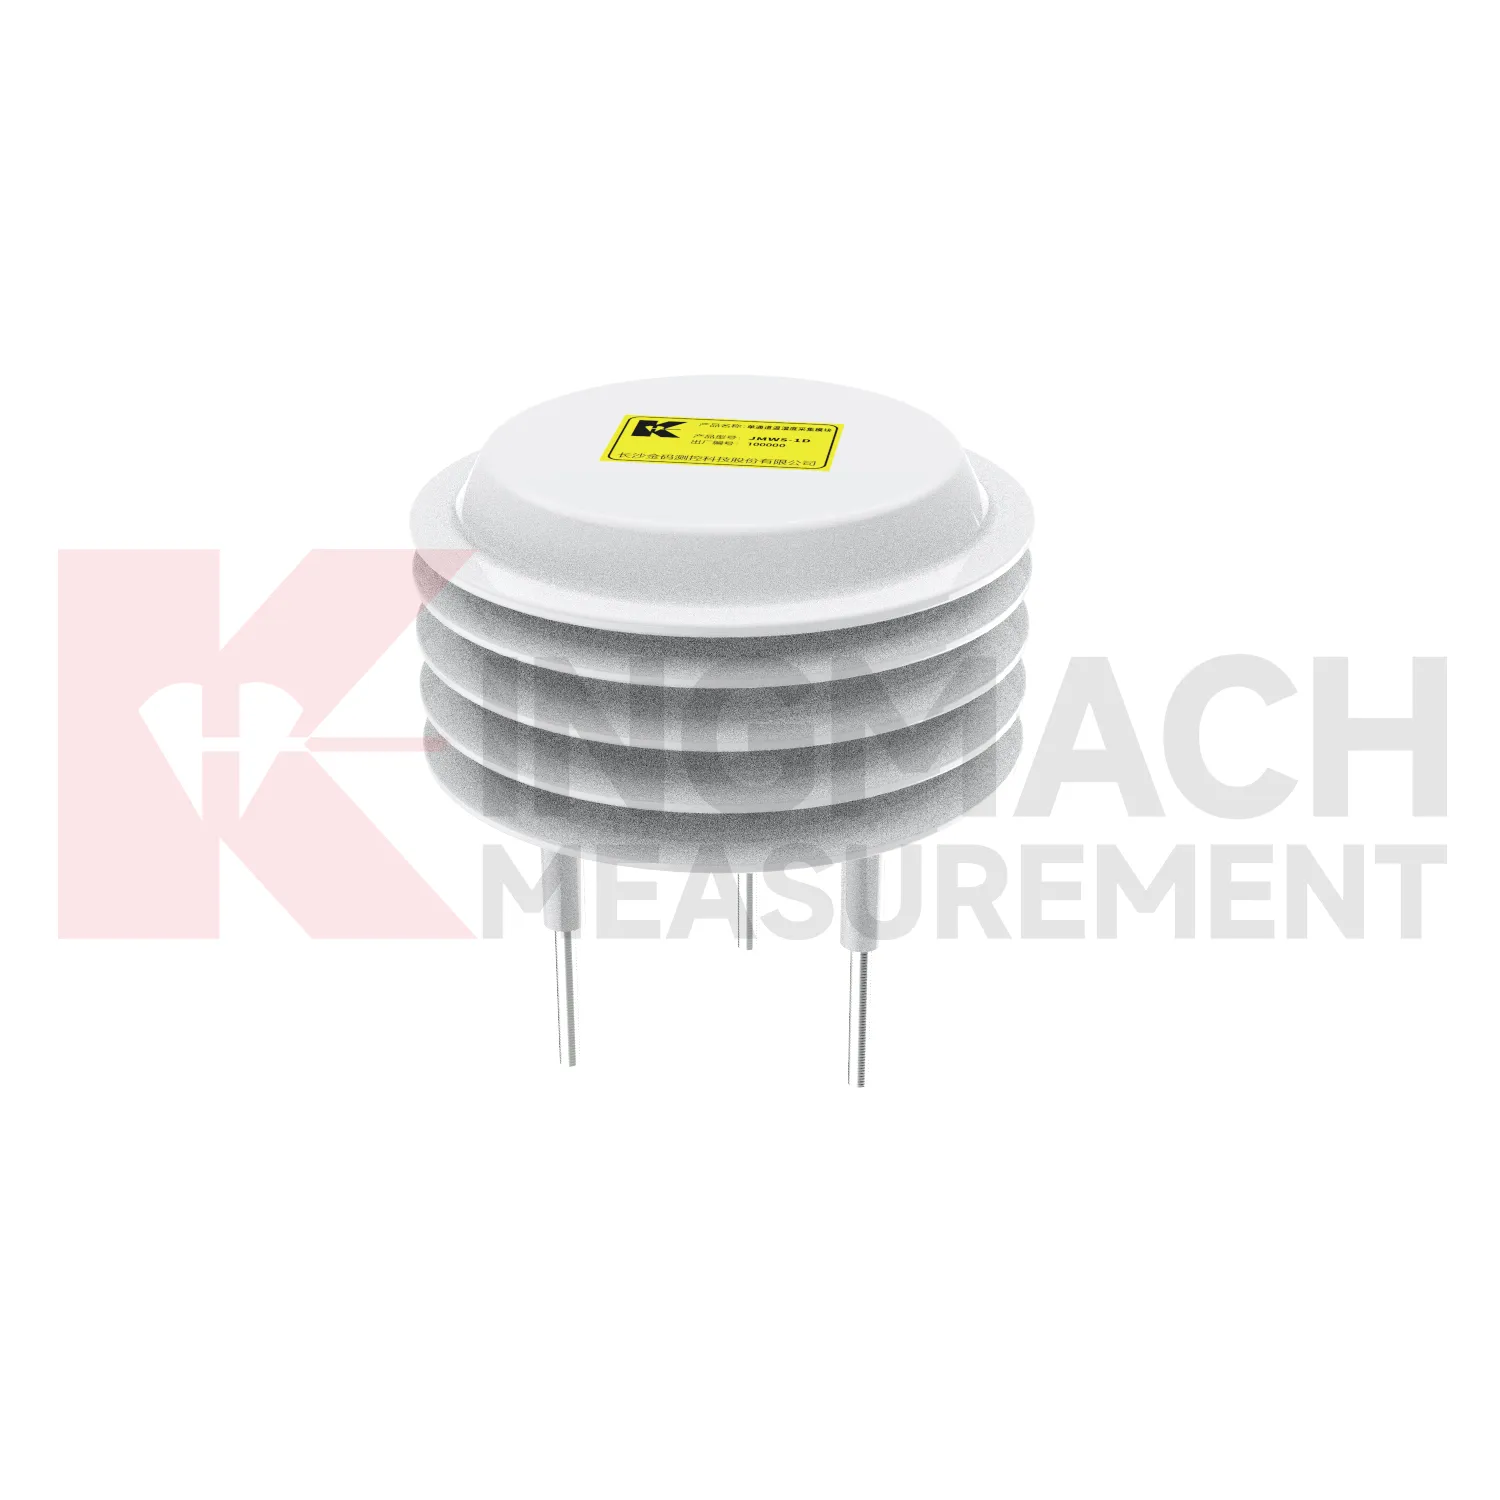
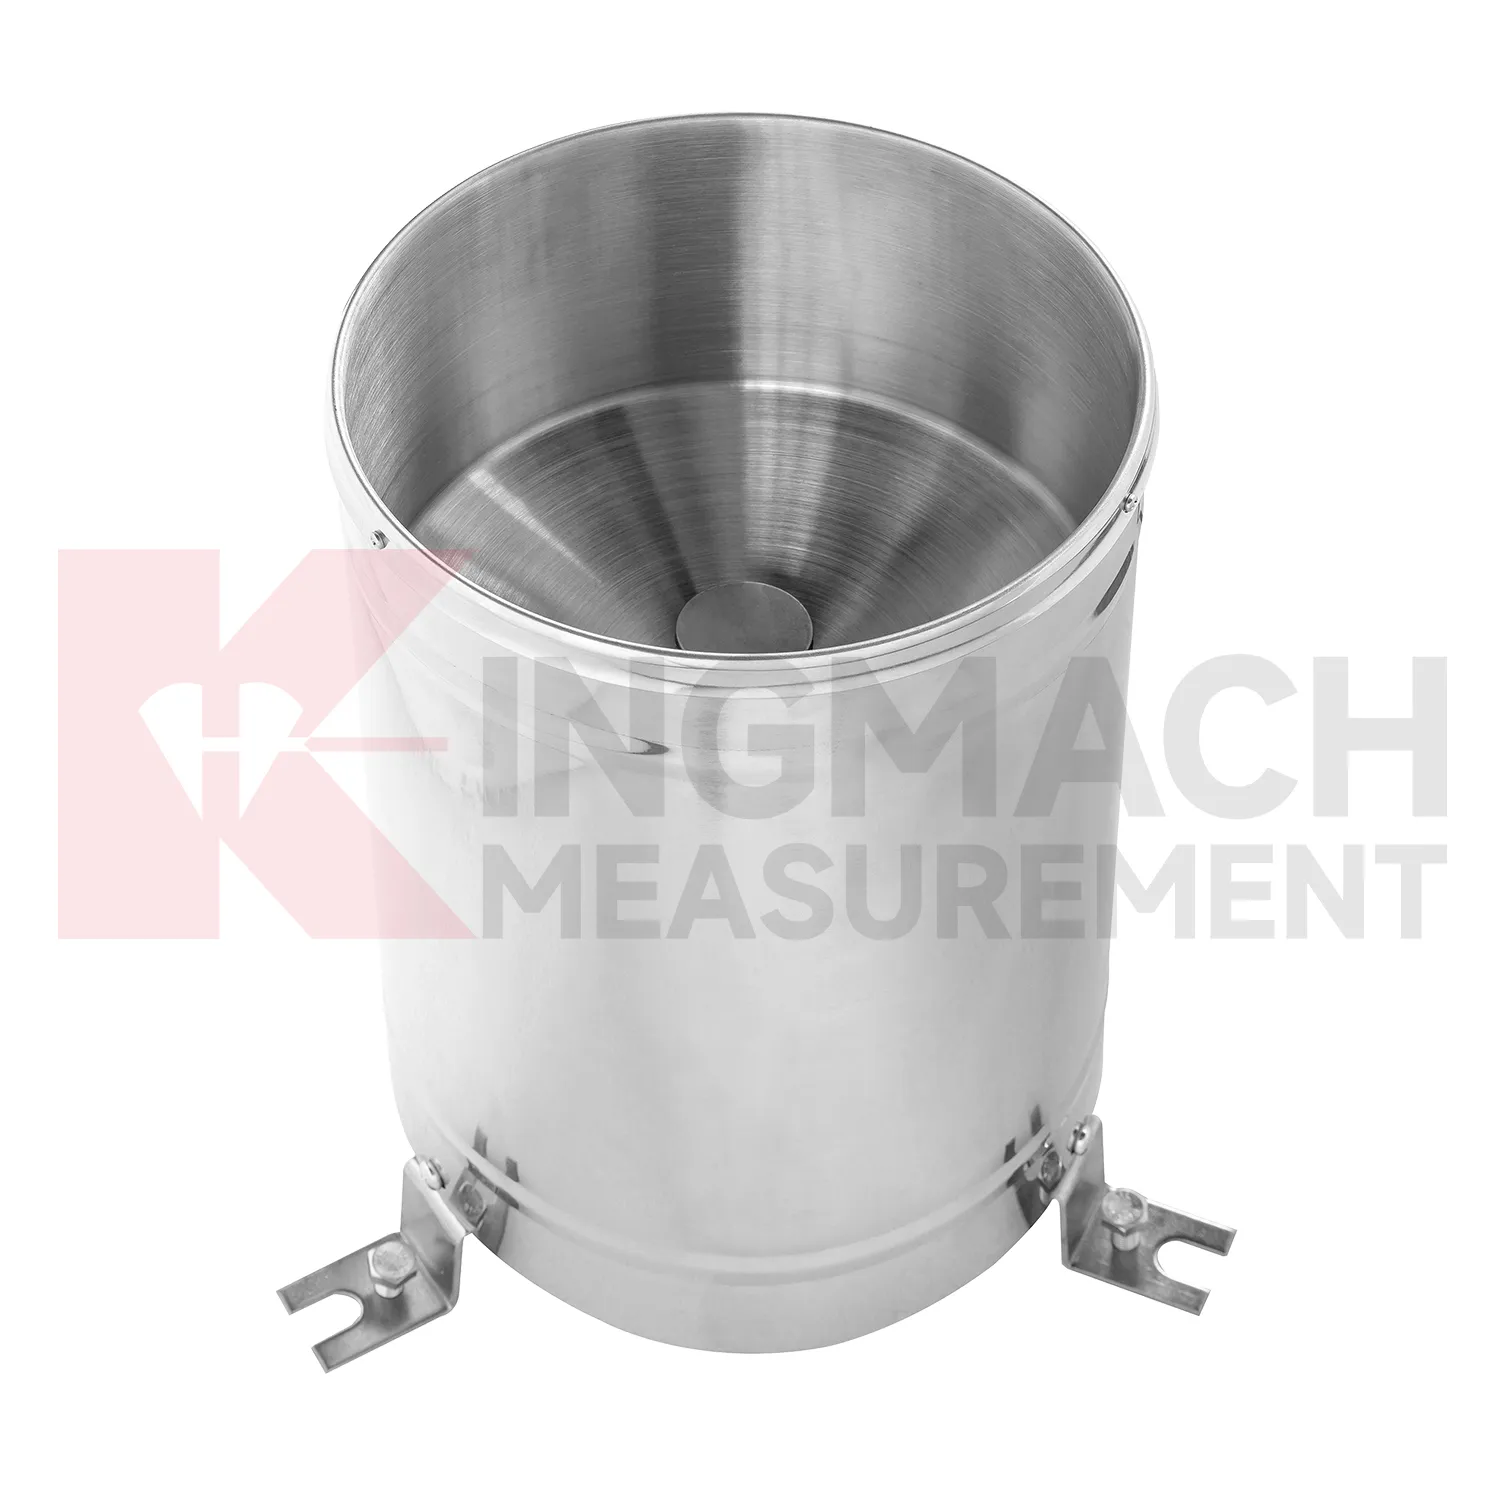
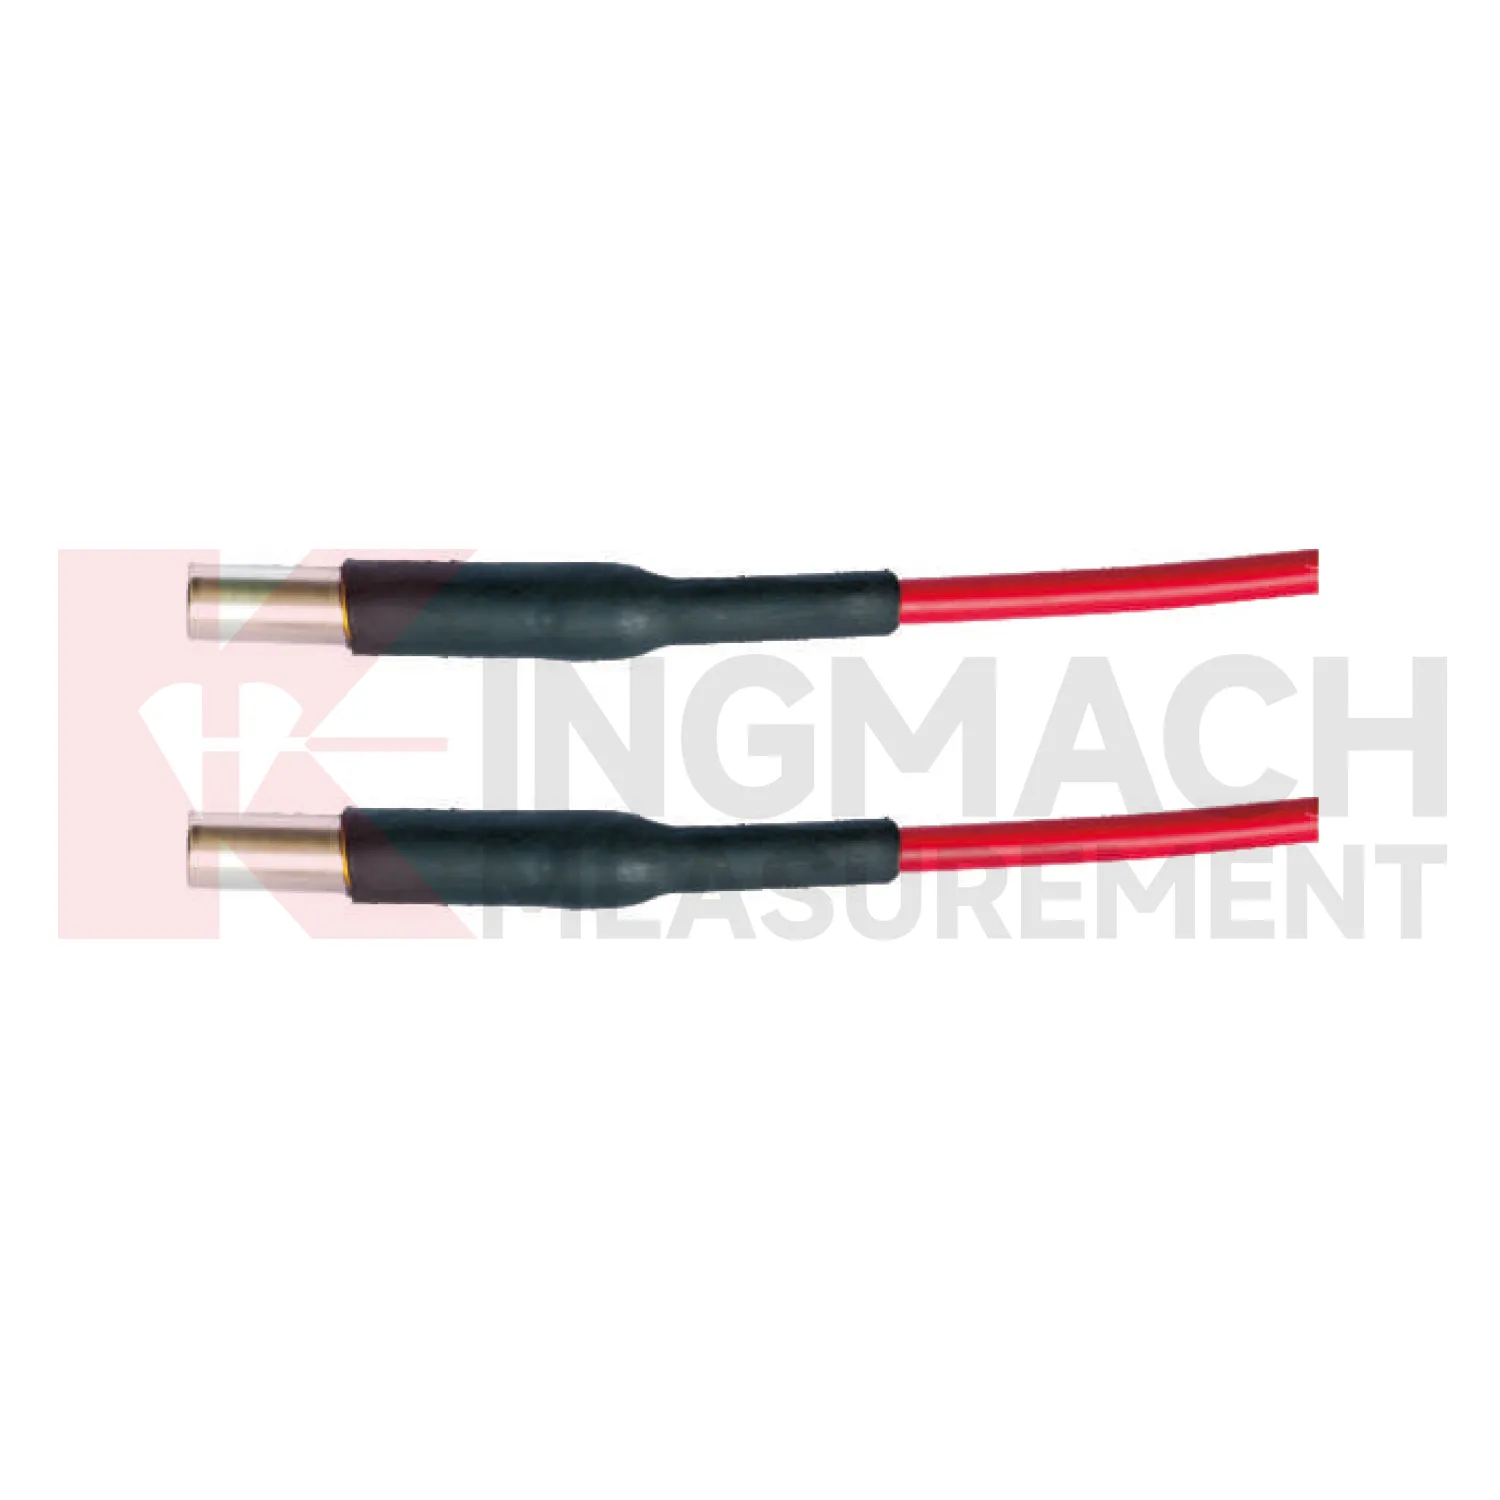
Kingmach Environmental Monitoring covers the site-condition layer of structural and geotechnical monitoring. It records the environmental forces and operating conditions that often explain why a structural sensor changes. Rainfall can precede slope movement or seepage; soil wetness can show whether water has reached a sensitive layer; temperature can affect strain, expansion, and sensor behavior; humidity can reveal cabinet and tunnel risks; wind can explain vibration, pressure, and access constraints. A useful description of this category should therefore start with the monitoring problem. The equipment is not installed to fill a dashboard with weather values. It is installed so engineers can compare conditions with settlement, displacement, tilt, load, vibration, strain, inspection notes, and maintenance actions. When these records share time stamps and point names, the owner can see both the trigger and the response. That makes abnormal-event review faster and helps long-term reports distinguish seasonal patterns from real deterioration.
If the reading seems unusual, the team should check the physical condition of the station before drawing conclusions about the asset. Blockage, poor exposure, loose wiring, water entry, and changed surroundings can all create misleading patterns.
A practical report links the condition value with time, place, and action. It should help a reviewer decide whether to keep observing, inspect the field point, compare nearby instruments, or record the event as normal site behavior.
Application of Environmental Monitoring
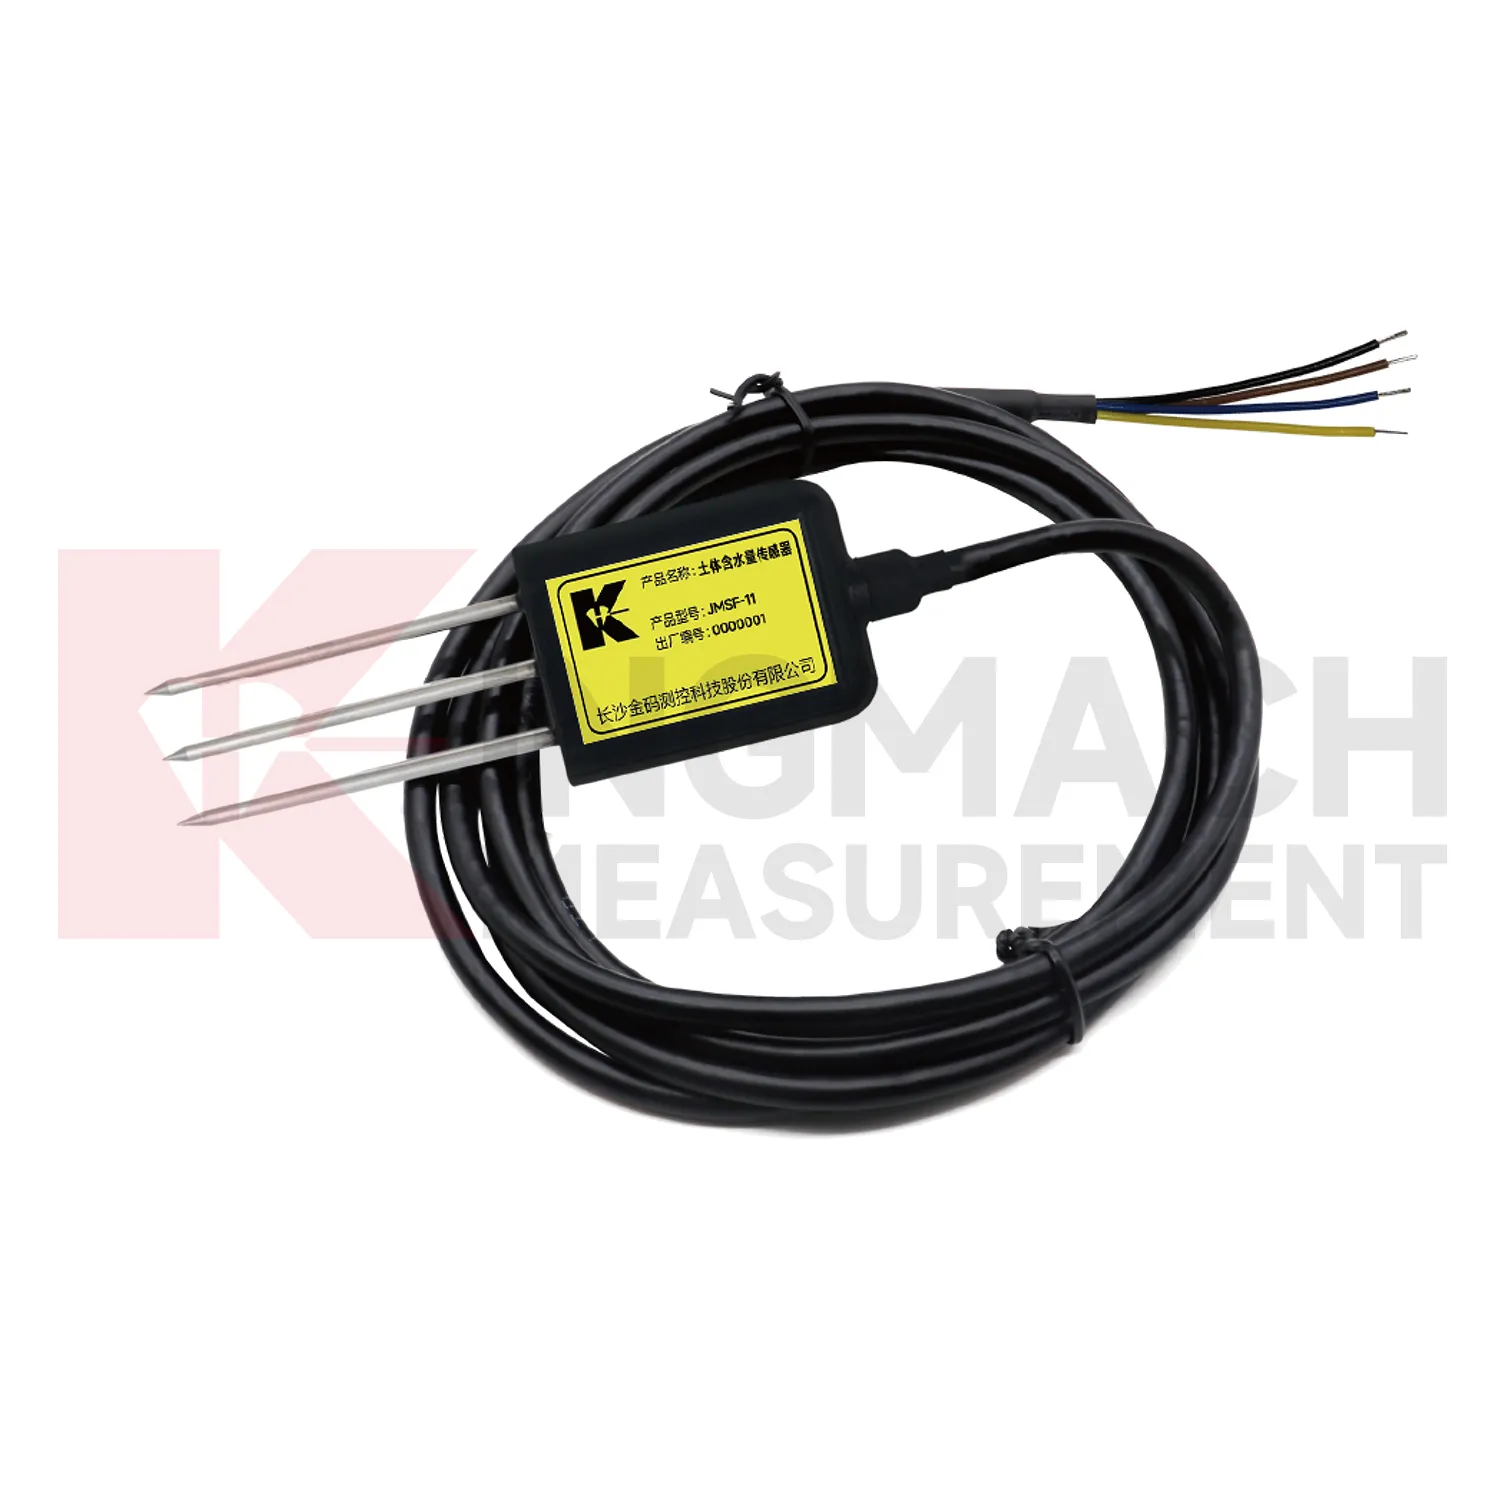
Agriculture and irrigation projects use Kingmach Environmental Monitoring to understand the relation between rainfall, irrigation, soil wetness, air conditions, and plant or ground response. The purpose is not just to display weather information. The record should help managers decide when soil is drying, whether irrigation reached the intended depth, whether rainfall replaced a scheduled watering event, and how greenhouse or field conditions changed over time. Probe depth, soil type, crop zone, irrigation schedule, and cable route should be recorded at installation. Air temperature and humidity can be reviewed with soil wetness to understand drying speed and growing conditions. A consistent environmental record supports practical water management and helps avoid decisions based only on surface appearance.
Maintenance teams should record cleaning, access difficulty, enclosure condition, cable repair, vegetation growth, nearby equipment changes, and the first normal reading after work. Those notes protect the meaning of the curve when old data is reviewed months later.
The environmental point should be part of a named monitoring question. It may explain wetting, drying, wind exposure, thermal movement, cabinet stress, or pressure variation, but that purpose needs to be visible in drawings and reports.
If the reading seems unusual, the team should check the physical condition of the station before drawing conclusions about the asset. Blockage, poor exposure, loose wiring, water entry, and changed surroundings can all create misleading patterns.
The future of Environmental Monitoring
Maintenance analytics will shape future Kingmach Environmental Monitoring. A rain point can clog, a soil point can lose contact, a wind point can become sheltered by new equipment, and a humidity point can be affected by cabinet changes. Future platforms can flag flatlines, impossible jumps, missing intervals, and disagreement between related channels. These checks will not replace field inspection, but they will tell teams where to look first. This is especially useful on large projects with many stations. Data quality alerts help prevent months of unreliable environmental records from being accepted as real site behavior.
The maintenance view should be different from the engineering alarm view. It should show station health, last inspection, cleaning history, power condition, enclosure status, and whether nearby site changes may have altered exposure. That helps field crews prioritize practical work before data quality falls.
Over time, maintenance analytics can reveal weak points in the monitoring network itself. If one station repeatedly needs cleaning, loses communication, or disagrees with nearby conditions, the owner can decide whether to improve access, change protection, or move the point to a better location.
Care & Maintenance of Environmental Monitoring
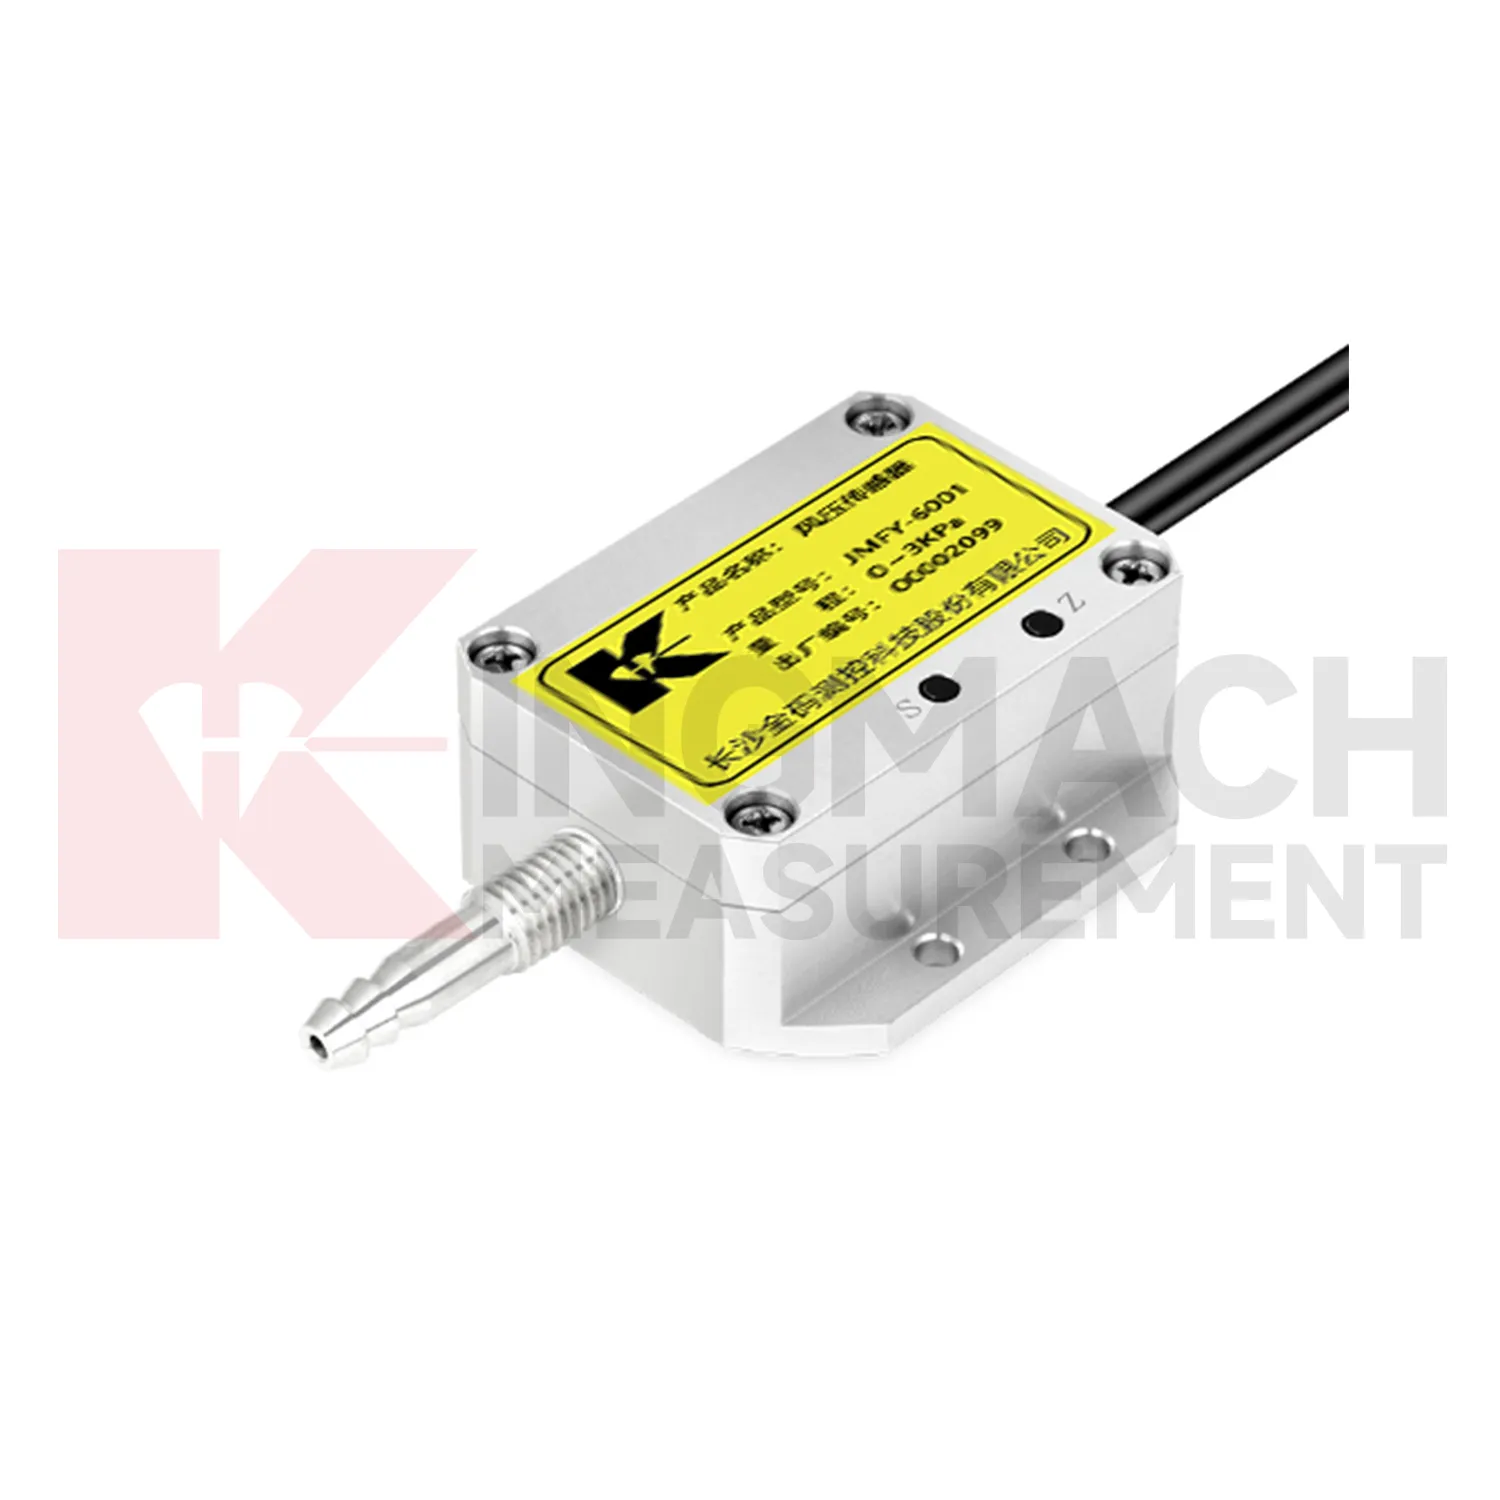
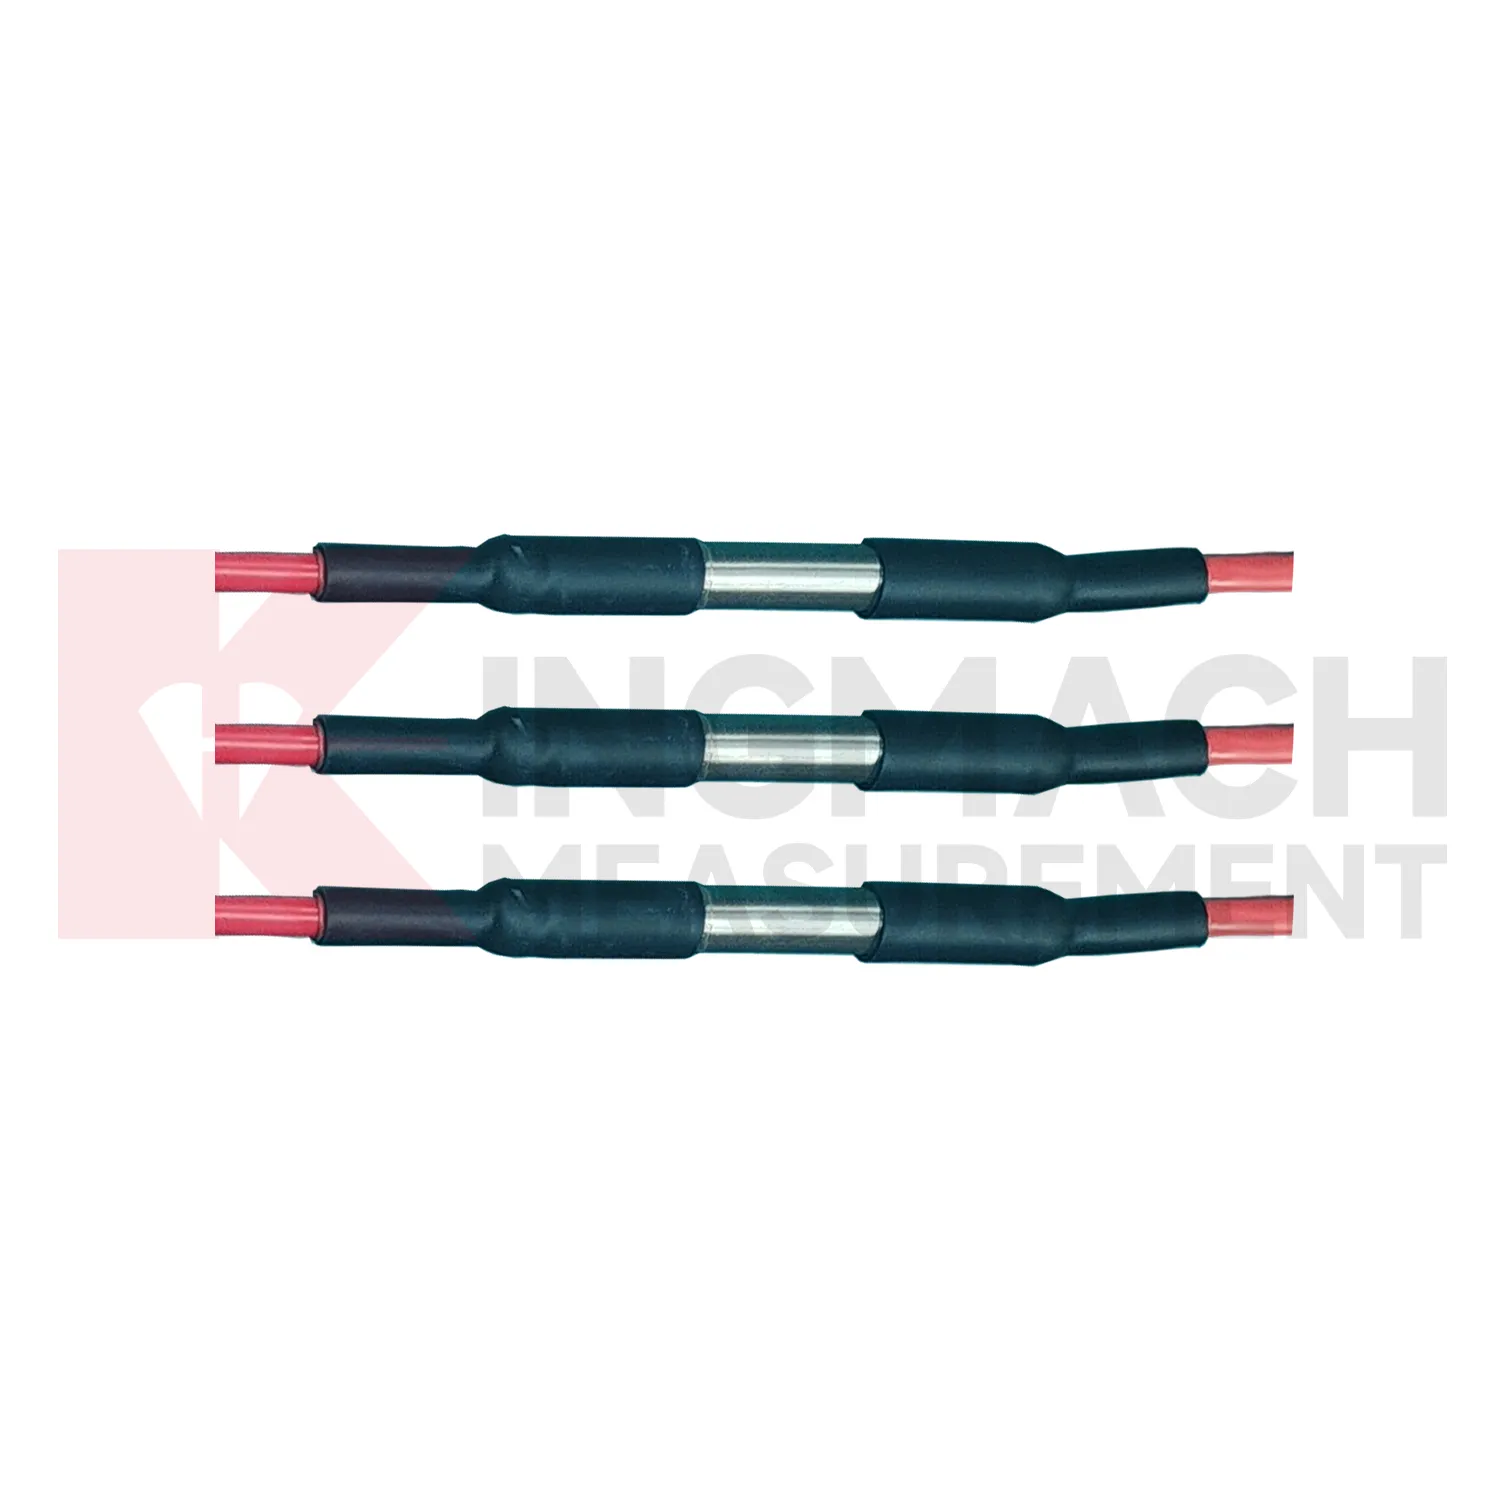
Pressure-channel maintenance for Kingmach Environmental Monitoring should keep the pressure path open, clean, and sealed. Tubes, ports, fittings, housings, cables, and power connections should be inspected after storms, dust exposure, washdown, cabinet work, or mechanical impact. Moisture, blockage, loose tubing, or wrong wiring can create readings that look like a pressure event. Pressure data may be reviewed beside wind, airflow, vibration, and structural response, so channel reliability matters. If pressure behavior does not match surrounding conditions, inspect the physical path before assuming the environment changed. A short maintenance note can prevent a long engineering debate later.
During abnormal events, the first question is not only whether the value crossed a limit. The reviewer should ask what changed around the site, whether the related structure reacted, and whether a field inspection confirmed the same pattern.
Long-term value comes from consistency. A channel that keeps the same location, unit, maintenance history, and linked asset record can support seasonal comparison, post-storm review, and handover between construction and operation teams.
Kingmach Environmental Monitoring
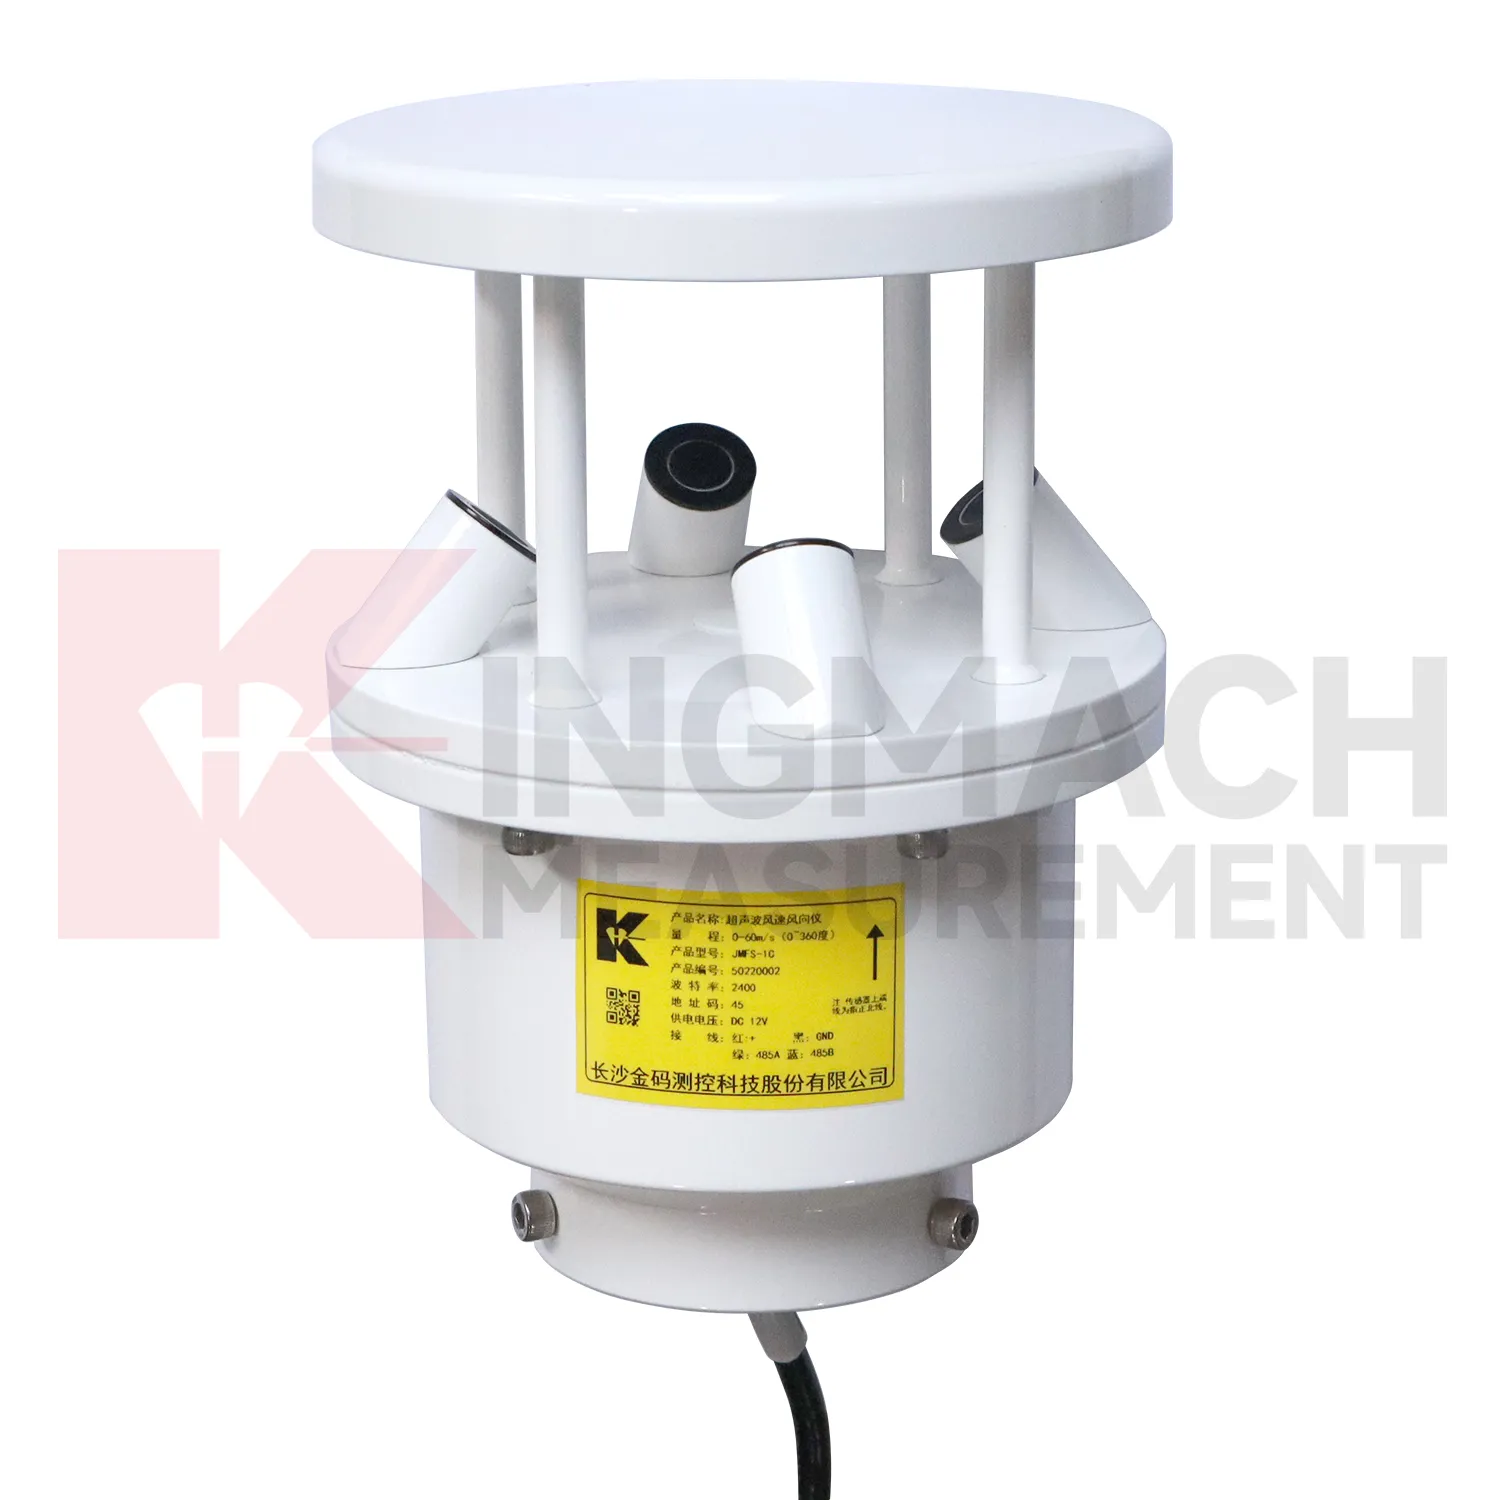
Wind exposure makes Kingmach Environmental Monitoring relevant to bridges, towers, airports, marine areas, tunnels, and high outdoor structures. Wind speed, direction, and pressure can affect vibration, access safety, temporary works, lifting operations, and inspection planning. A bridge response during strong crosswind should not be read the same way as a response during calm weather. A tower vibration record means more when the wind direction and timing are known. Wind data should be placed where it represents the monitored asset, with attention to height, obstruction, mounting stability, and cable protection. A clean wind record gives engineers a way to separate normal weather-driven response from behavior that needs a closer structural review.
For field teams, this point is most useful when the record shows the condition before the structural response, during the response, and after the site returns to routine operation. The note should include weather timing, inspection access, nearby construction, and whether the linked structural points changed in the same period.
FAQ
Q: What maintenance does Kingmach Environmental Monitoring need?
A: Maintenance includes cleaning, leveling, exposure checks, cable inspection, enclosure checks, unit verification, and data-quality review.
Q: What should be checked after storms?
A: Check rain catchment, cabinet water entry, cable damage, wind mounting, soil-point disturbance, and the first stable data after inspection.
Q: What causes misleading records?
A: Poor placement, blocked catchment, sheltered wind exposure, weak soil contact, water in cabinets, channel swaps, or missing maintenance notes can mislead reviewers.
Q: How often should inspections happen?
A: Frequency depends on exposure, asset risk, access, weather season, and how strongly the environmental data affects engineering decisions.
Q: How should replacement be handled?
A: Record the old and new condition, date, reason, point photo, channel change, and first stable value after replacement.
The environmental point should be part of a named monitoring question. It may explain wetting, drying, wind exposure, thermal movement, cabinet stress, or pressure variation, but that purpose needs to be visible in drawings and reports.
Reviews
Michael Anderson
The strain gauges and load cells are extremely accurate and stable. They performed very well in our bridge monitoring project. Highly recommended!
Joshua Clark
We ordered a full monitoring solution including sensors and data loggers. Everything works seamlessly together. Great supplier!
Latest Inquiries
To protect the privacy of our buyers, only public service email domains like Gmail, Yahoo, and MSN will be displayed. Additionally, only a limited portion of the inquiry content will be shown.
Charlotte***@gmail.comUnited Arab Emirates
Hi, we require instrumentation cables suitable for harsh environments. Could you advise on specifica...
Emma***@gmail.comCanada
Dear Sir/Madam, we are interested in displacement transducers and settlement sensors for a geotechni...
Related product categories
- Integrated Monitoring Station
- Soil Water Content Sensor
- Ultrasonic Anemometer
- semiconductor temperature sensor
- semiconductor based temperature sensors
- semiconductor temperature sensors
- semiconductor based temperature sensor
- semiconductor based ic temperature sensor
- semiconductor-based temperature sensors
- resistance temperature detector sensor
- resistive temperature sensor
- resistance temperature sensor