
 EN
EN
 ar
ar bg
bg hr
hr cs
cs da
da nl
nl fi
fi fr
fr de
de el
el hi
hi it
it ko
ko no
no pl
pl pt
pt ro
ro ru
ru es
es sv
sv tl
tl iw
iw id
id lv
lv lt
lt sr
sr sk
sk sl
sl uk
uk vi
vi et
et hu
hu th
th tr
tr fa
fa ms
ms hy
hy ka
ka ur
ur bn
bn mn
mn ta
ta kk
kk uz
uz ku
ku
load cell connection diagram
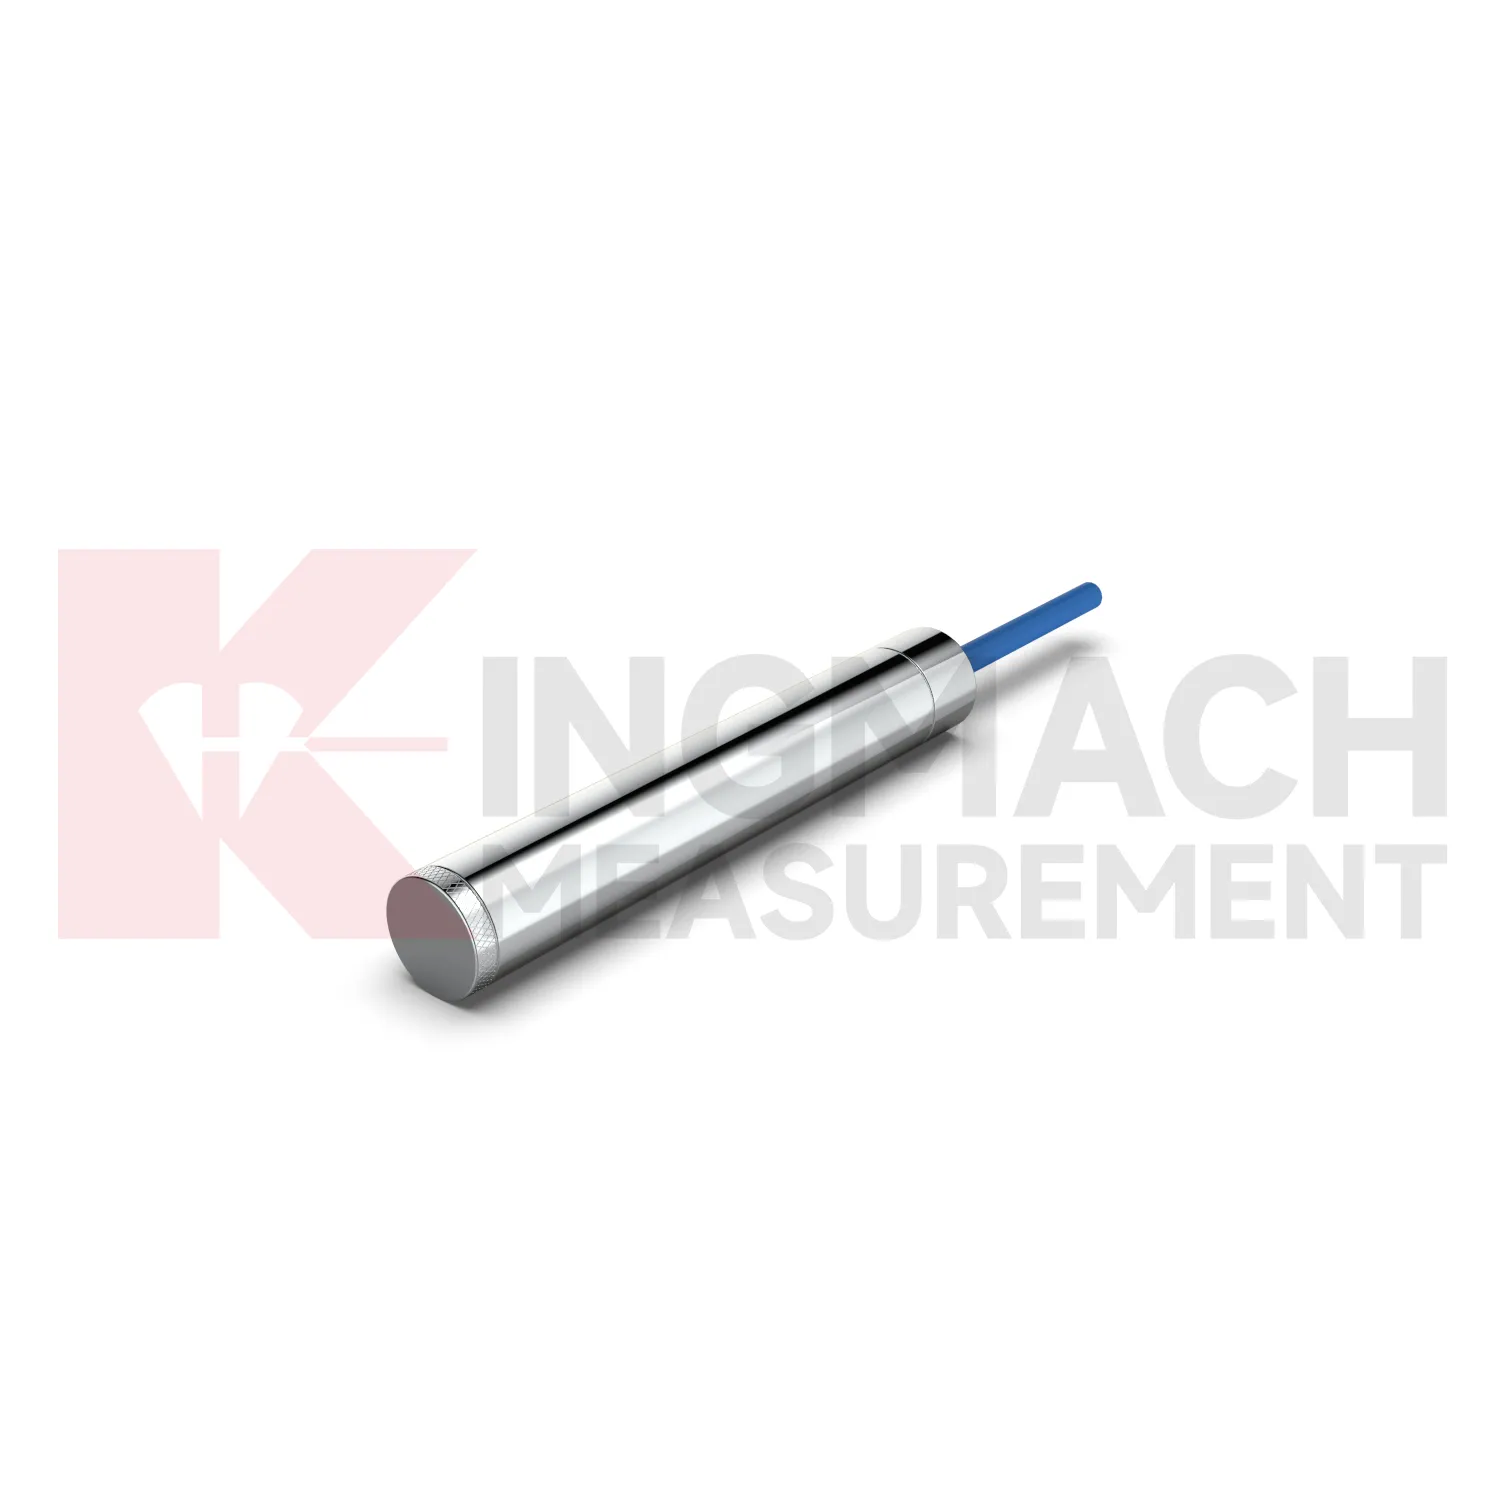
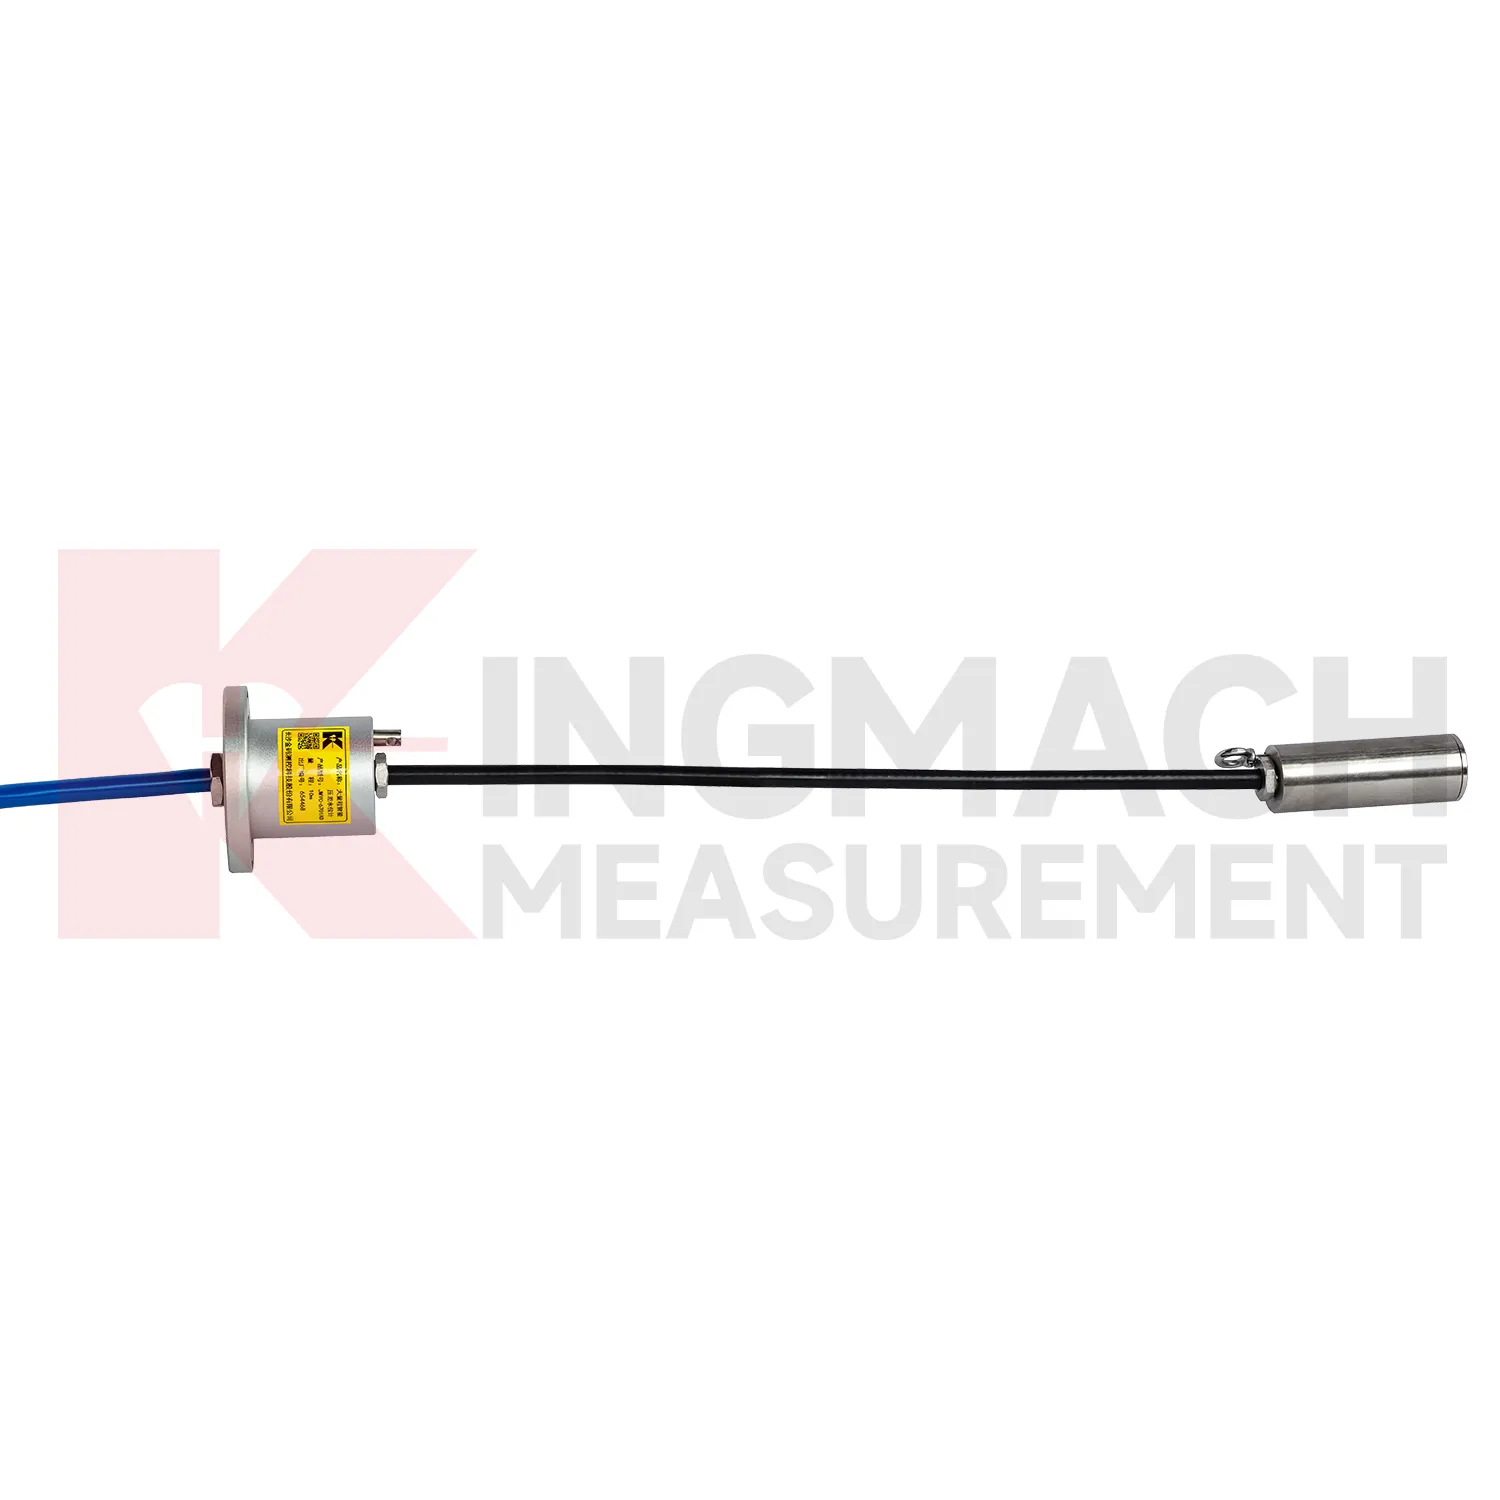
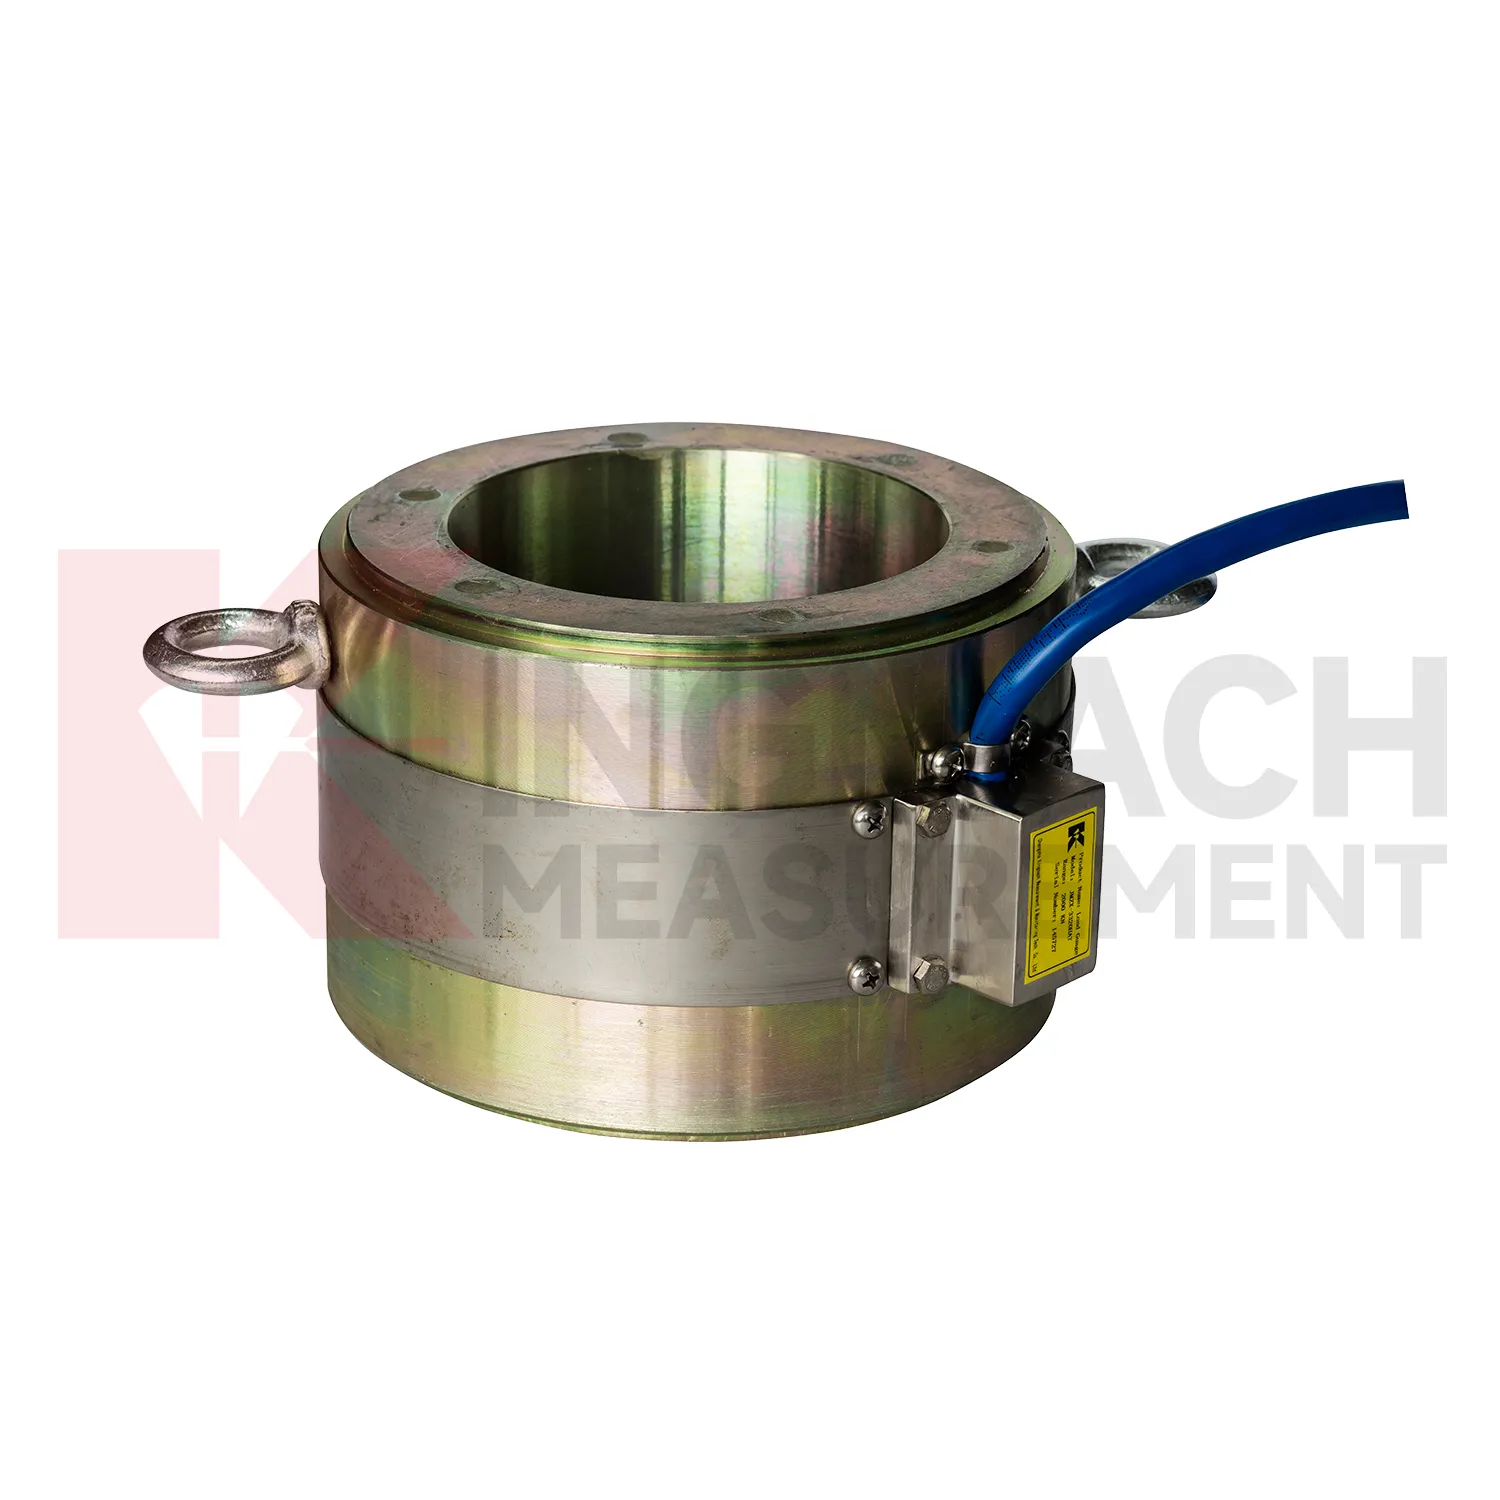
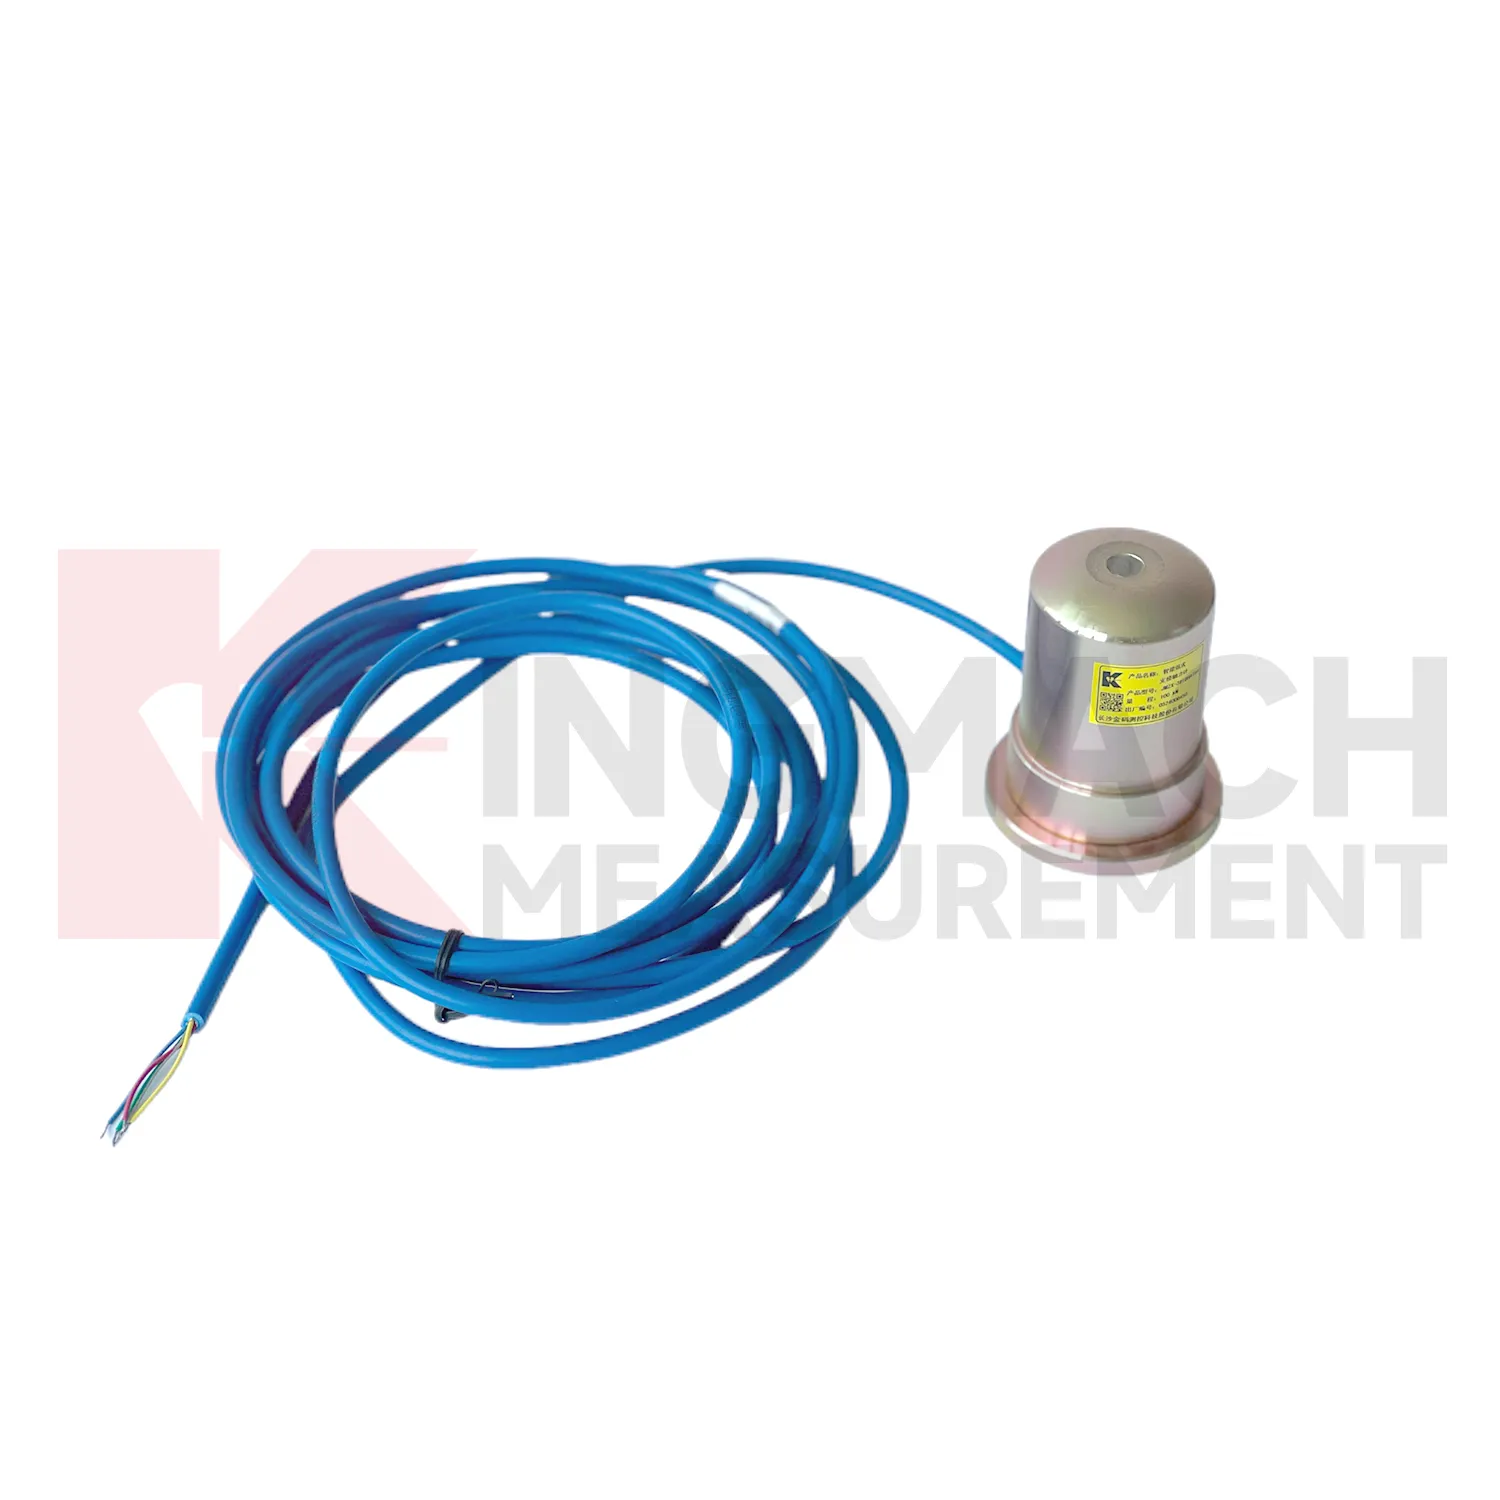
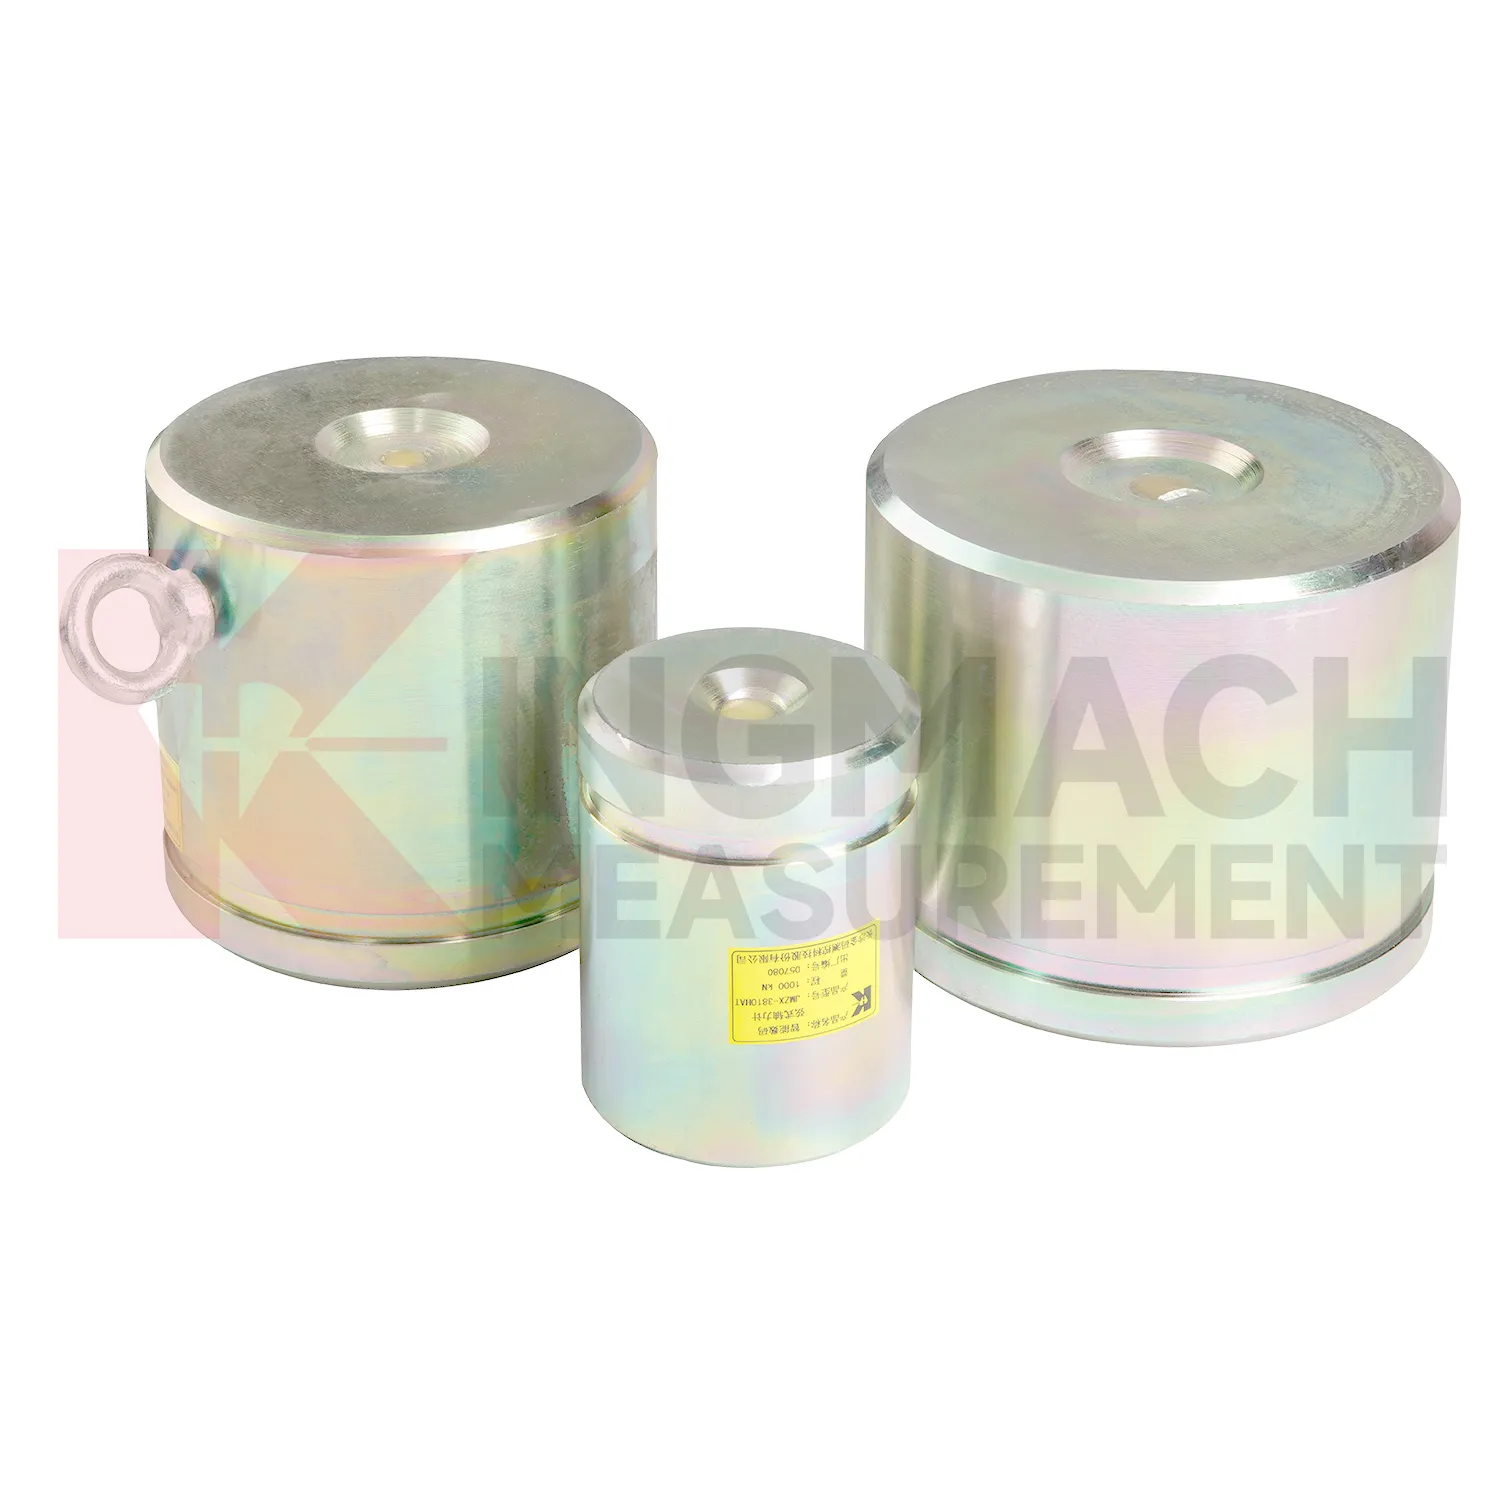
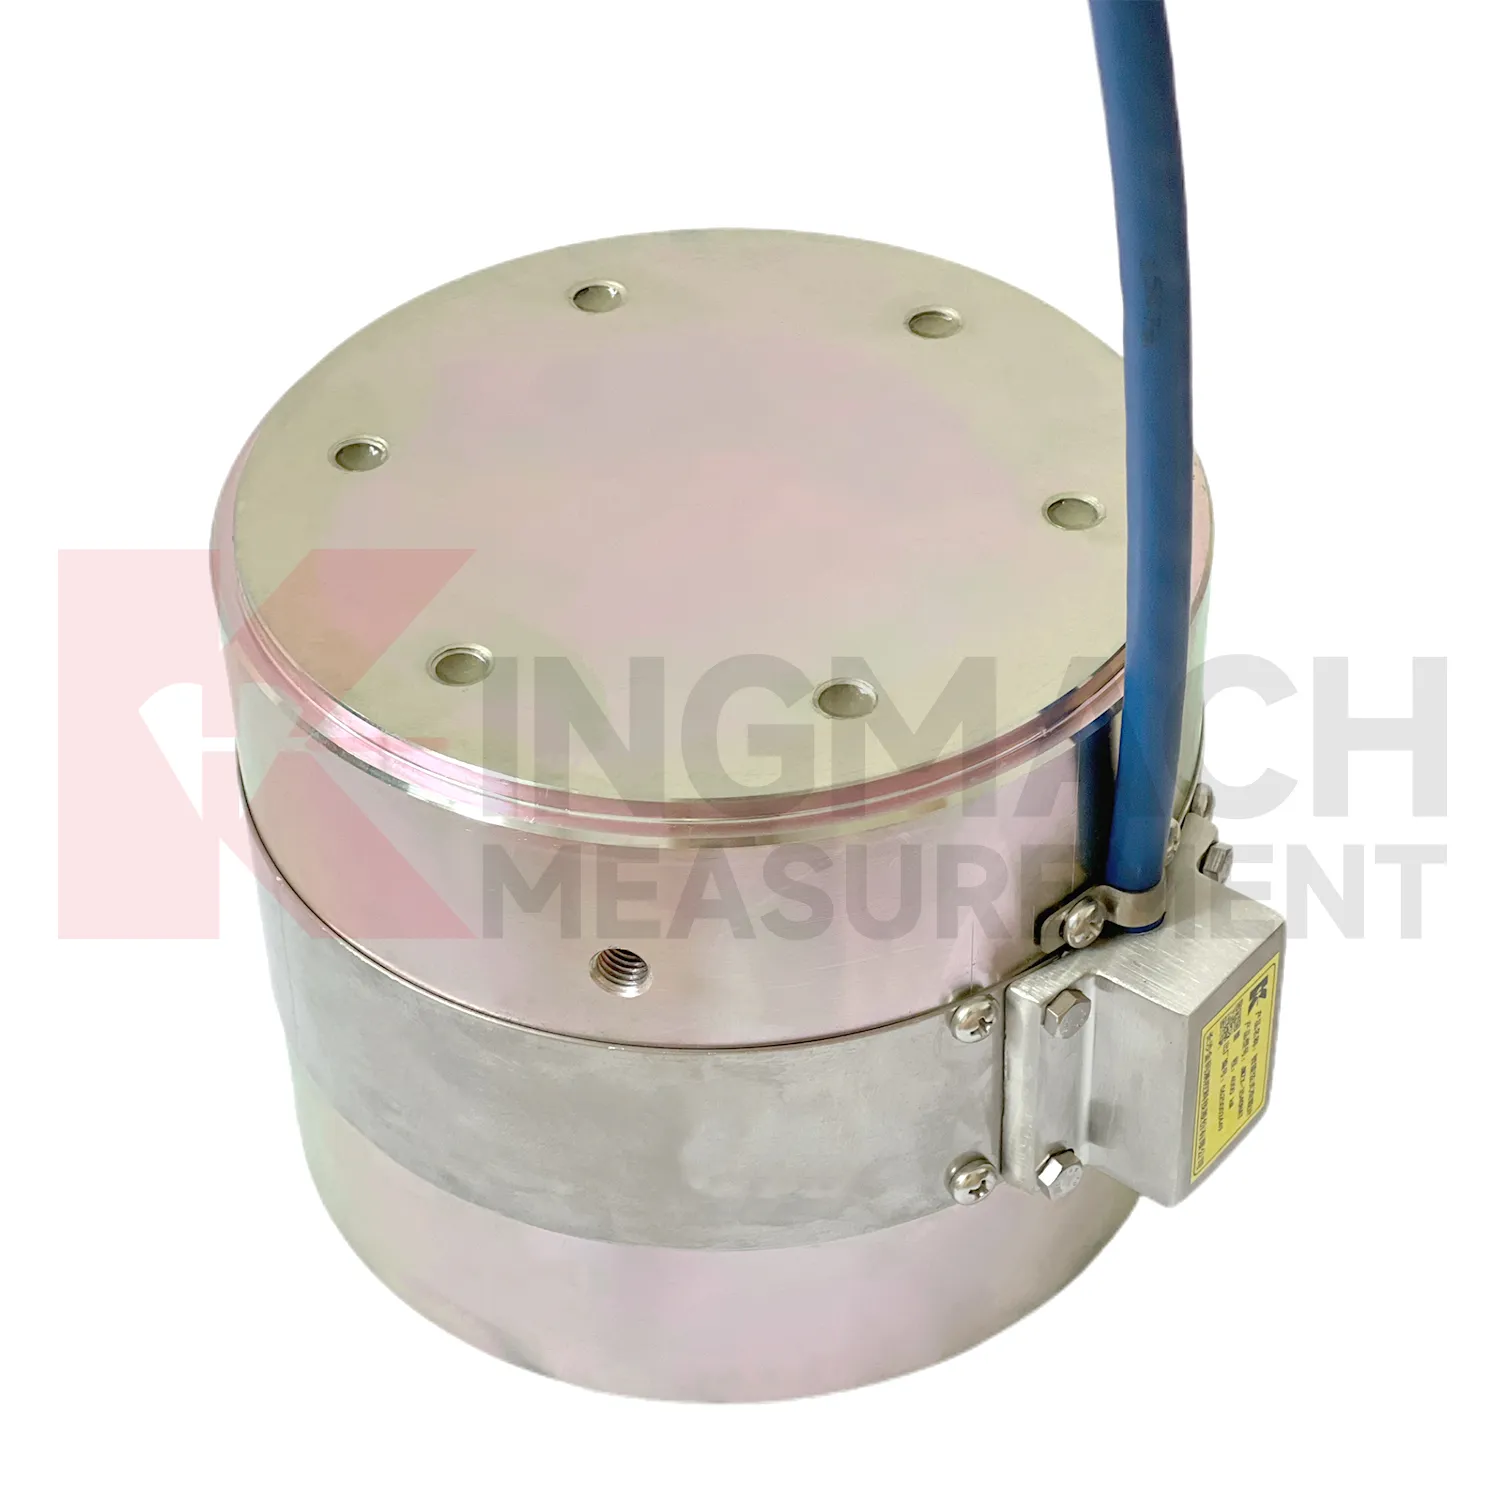
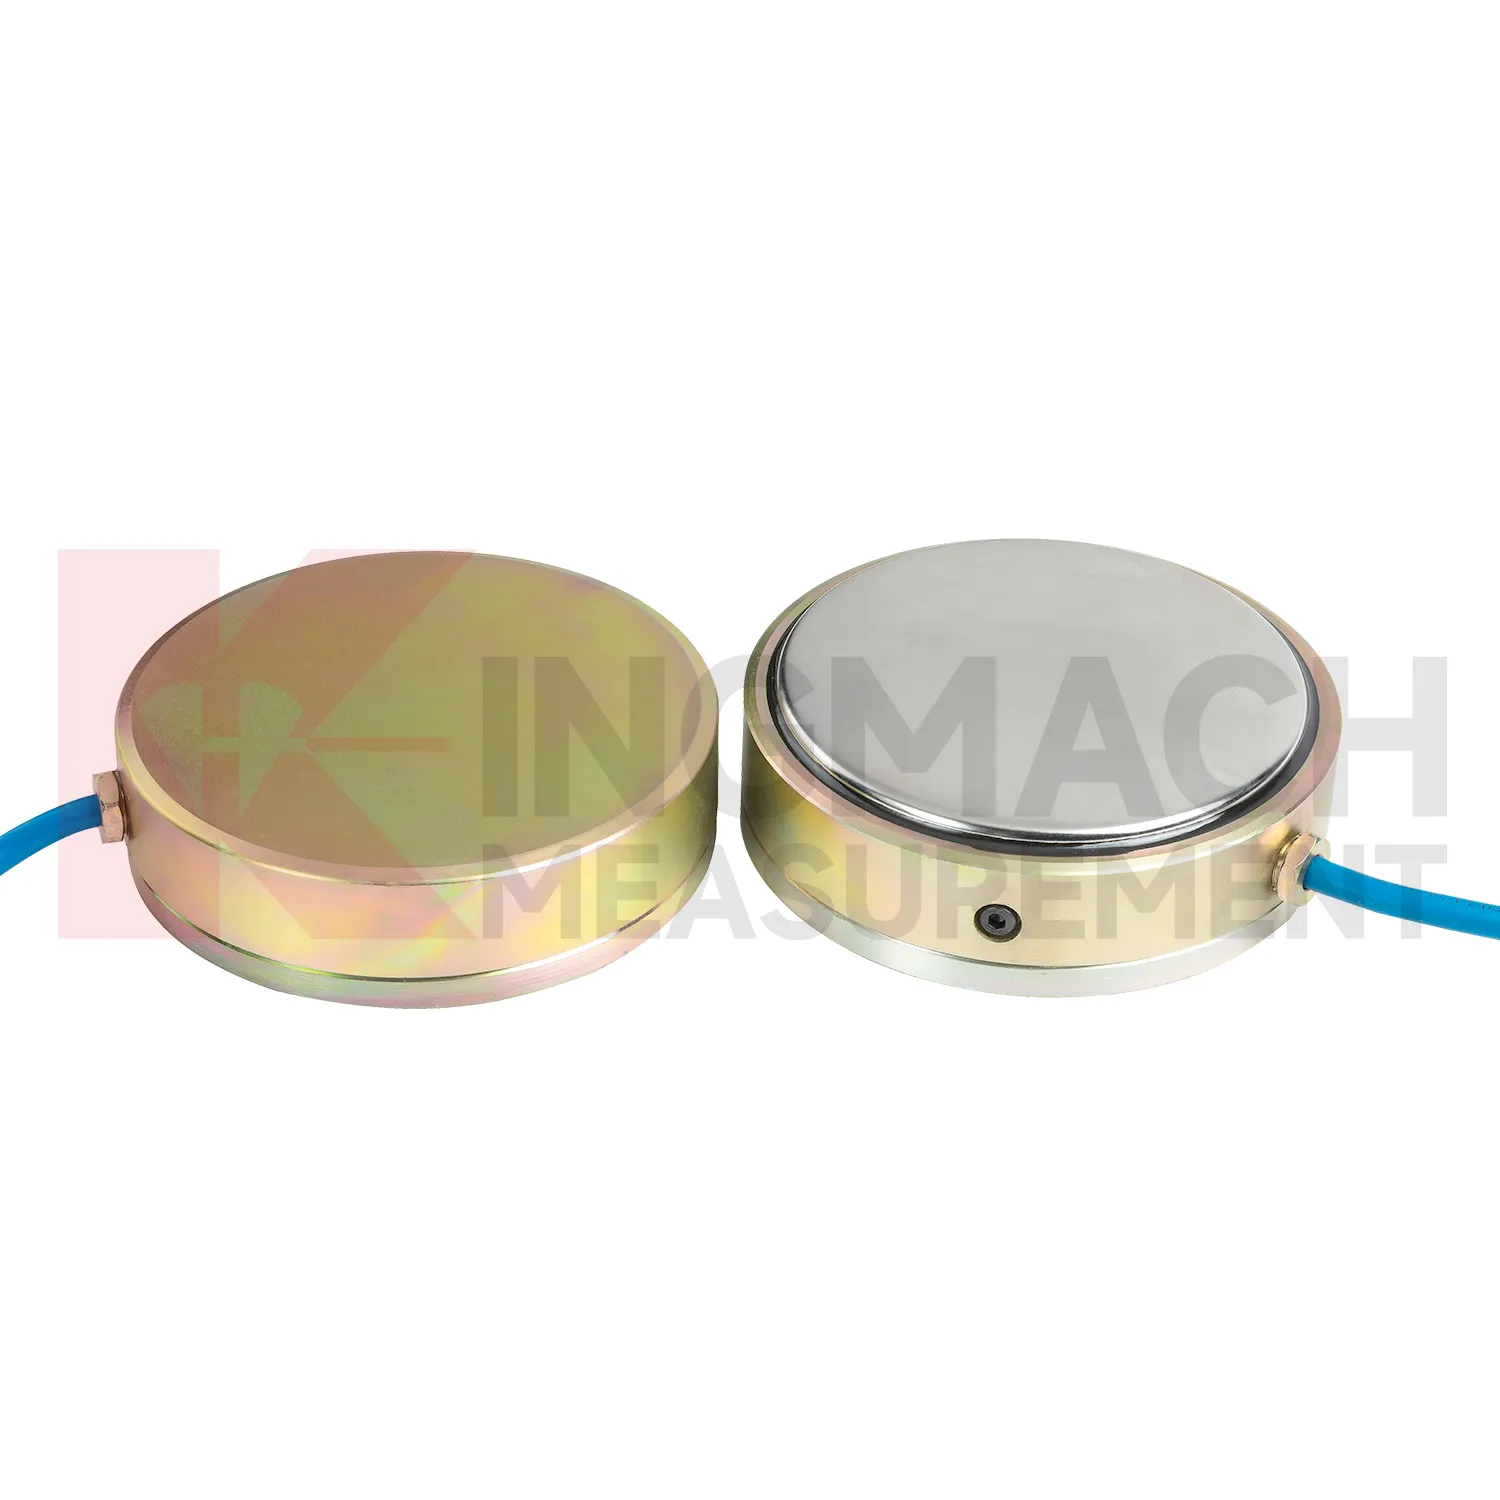
Kingmach load cell connection diagram can be specified as part of a complete monitoring workflow rather than as a standalone instrument. Product pages mention manual readout compatibility, comprehensive vibrating wire readouts, automated acquisition, and storage of model or calibration information inside smart sensors. On listed models, force ranges extend from 200 kN on smaller axial force meters to 10000 kN on high capacity solid load cells, while pressure related models cover 0.3 MPa to 8 MPa. The presence of temperature correction, waterproof construction, digital output, and stable vibrating wire sensing helps the same installation work through construction and service periods. Kingmach's support range includes data loggers, instrumentation cables, and visualization software, so project teams can plan channel naming, alarm limits, report format, and maintenance inspection around the sensor from the beginning. That reduces later confusion when hundreds of monitoring points are installed across a bridge, subway, dam, slope, or foundation project. Viewed as a package, the product, readout, cable, calibration record, and software connection all affect data quality. Kingmach's catalog structure helps buyers think about that whole chain rather than treating the sensor as a loose component. For long projects, that shared record reduces confusion when installation teams, monitoring teams, and maintenance teams are not the same people.
Application of load cell connection diagram
In monitoring networks that cover several structures, load cell connection diagram gives force and pressure points a place beside displacement, settlement, tilt, vibration, water level, and environmental data. The project pain point is interpretation across many channels. A force increase in a foundation pit may be normal after excavation, while a similar increase on a dam anchor after water level change may need closer review. Kingmach smart sensors can store model data, calibration coefficients, zero values, temperature data, and up to 800 records on relevant models. Load ranges across the family include 200 kN to 10000 kN for force products and 0.3 MPa to 8 MPa for earth pressure cells. When connected through readouts, data loggers, DTUs, or software platforms, these points can be reviewed by location and time. Good channel naming, consistent units, alarm thresholds based on design stages, and periodic field checks prevent the network from becoming a pile of disconnected numbers. Large networks also need a naming convention that crews can understand on site. A channel label that matches drawings, physical tags, and software screens prevents mistakes when alarms arrive during night work or bad weather. The platform should keep the raw reading history available, so later reviewers can see whether an alarm came from a real trend or a setup change.
The future of load cell connection diagram
In tunnels and foundation pits, future load cell connection diagram use will move toward faster construction stage feedback. Axial force meters with 200 kN to 3000 kN ranges, 0.5%FS accuracy, direct kN display, and 1 MPa waterproofing already suit support load monitoring. The next step is pairing those readings with excavation depth, support installation time, groundwater level, wall displacement, and site progress records. LoRa or 4G gateways can reduce manual rounds where access is unsafe or work is moving too fast. Edge devices can flag missing channels, abnormal drift, or readings that changed after a cable was disturbed. This is different from a vague smart site label. It is a specific workflow where the sensor reading is checked against the work stage that should have caused it. As urban underground projects face stricter monitoring requirements, instruments that combine rugged installation, direct force output, and platform access will fit the way contractors actually manage risk.
Care & Maintenance of load cell connection diagram
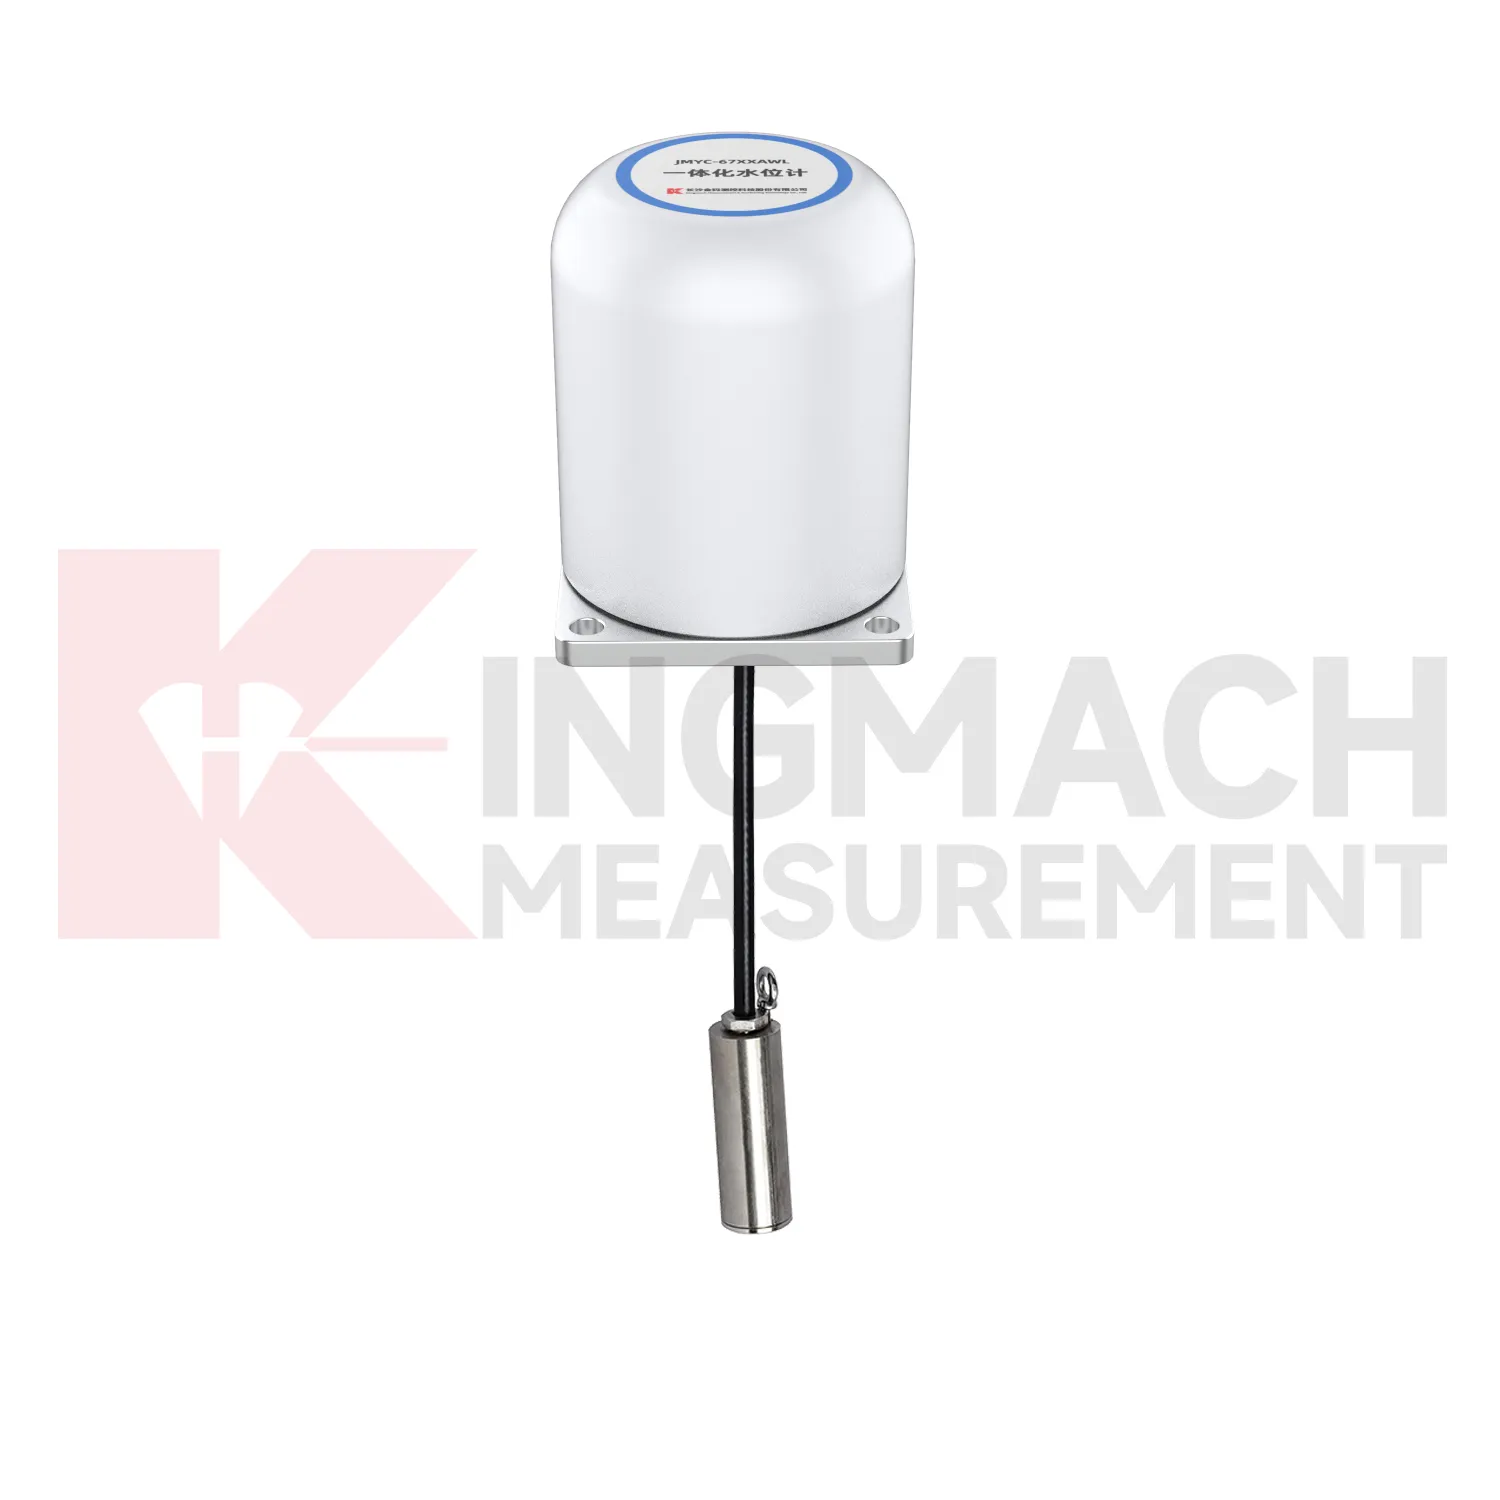
For load cell connection diagram working in cold, hot, or wet environments, maintenance should use the product parameters as inspection triggers. Solid load cells list a -30°C to 80°C temperature range, while axial force meters list 1 MPa waterproof performance and earth pressure cells list ±0.5°C temperature accuracy. These ratings help, but field practice still matters. During installation, keep connectors dry, avoid sharp cable bends, prevent direct mechanical blows, and secure the instrument away from water pooling where possible. During long term use, inspect after freeze-thaw cycles, heat waves, storms, flooding, and nearby welding or electrical work. Temperature correction should reduce measurement influence, but readings should still be reviewed with the actual site temperature. If a value moves only during daily temperature swings, check the thermal pattern before issuing a structural warning. If a value changes after water exposure, inspect sealing and cable insulation before resetting alarm thresholds. Do not ignore seasonal effects.
Kingmach load cell connection diagram
load cell connection diagram is useful where the risk is not dramatic movement but slow, uneven load transfer. A bridge cable may relax in small steps, a support jack may settle after locking, a foundation pit strut may gain force overnight, and a dam anchor may respond to water level changes. Kingmach force monitoring products are designed for these long observation periods, with smart chips, temperature correction, waterproof structures, and compatible readouts or acquisition units across several models. The working value comes from repeatable measurement under real site conditions. That includes dust, water, vibration, long cable runs, tight installation space, and crews working around the instrument. A good record helps teams separate normal load fluctuation from a developing problem. It also reduces arguments during handover, because the reading is tied to a named point, a calibrated model, a timestamp, and the same measurement method used throughout the project. The result is a record that can survive handover between contractors and owners.
FAQ
Q: How can load cell connection diagram be connected to a monitoring platform? A: Use compatible readouts, acquisition modules, data loggers, DTUs, and software platforms according to site access, cable distance, power, and reporting requirements. Q: What makes smart models useful in large networks? A: Stored model data, calibration coefficients, zero values, temperature data, and measurement records reduce confusion across many channels. Q: Should manual readings still be kept? A: Yes, manual checks are useful after installation, maintenance, abnormal alarms, or logger changes. Q: How should alarm limits be set? A: Base them on design stage, sensor range, expected load change, temperature behavior, and nearby monitoring points. Q: What data should be reviewed together with force? A: Settlement, displacement, tilt, water level, pore pressure, rainfall, temperature, construction events, and inspection notes.
Reviews
Daniel Brown
Excellent environmental monitoring sensors. The data is consistent, and the system integrates smoothly with our existing setup.
David Wilson
We purchased displacement transducers and settlement sensors, and the quality exceeded our expectations. Easy installation and reliable performance.
Latest Inquiries
To protect the privacy of our buyers, only public service email domains like Gmail, Yahoo, and MSN will be displayed. Additionally, only a limited portion of the inquiry content will be shown.
Emma***@gmail.comCanada
Dear Sir/Madam, we are interested in displacement transducers and settlement sensors for a geotechni...
Isabella***@gmail.comGermany
Hello, we are evaluating weir flow meters for a water management project. Please share accuracy deta...