 ar
ar bg
bg hr
hr cs
cs da
da nl
nl fi
fi fr
fr de
de el
el hi
hi it
it ko
ko no
no pl
pl pt
pt ro
ro ru
ru es
es sv
sv tl
tl iw
iw id
id lv
lv lt
lt sr
sr sk
sk sl
sl uk
uk vi
vi et
et hu
hu th
th tr
tr fa
fa ms
ms hy
hy ka
ka ur
ur bn
bn mn
mn ta
ta kk
kk uz
uz ku
ku
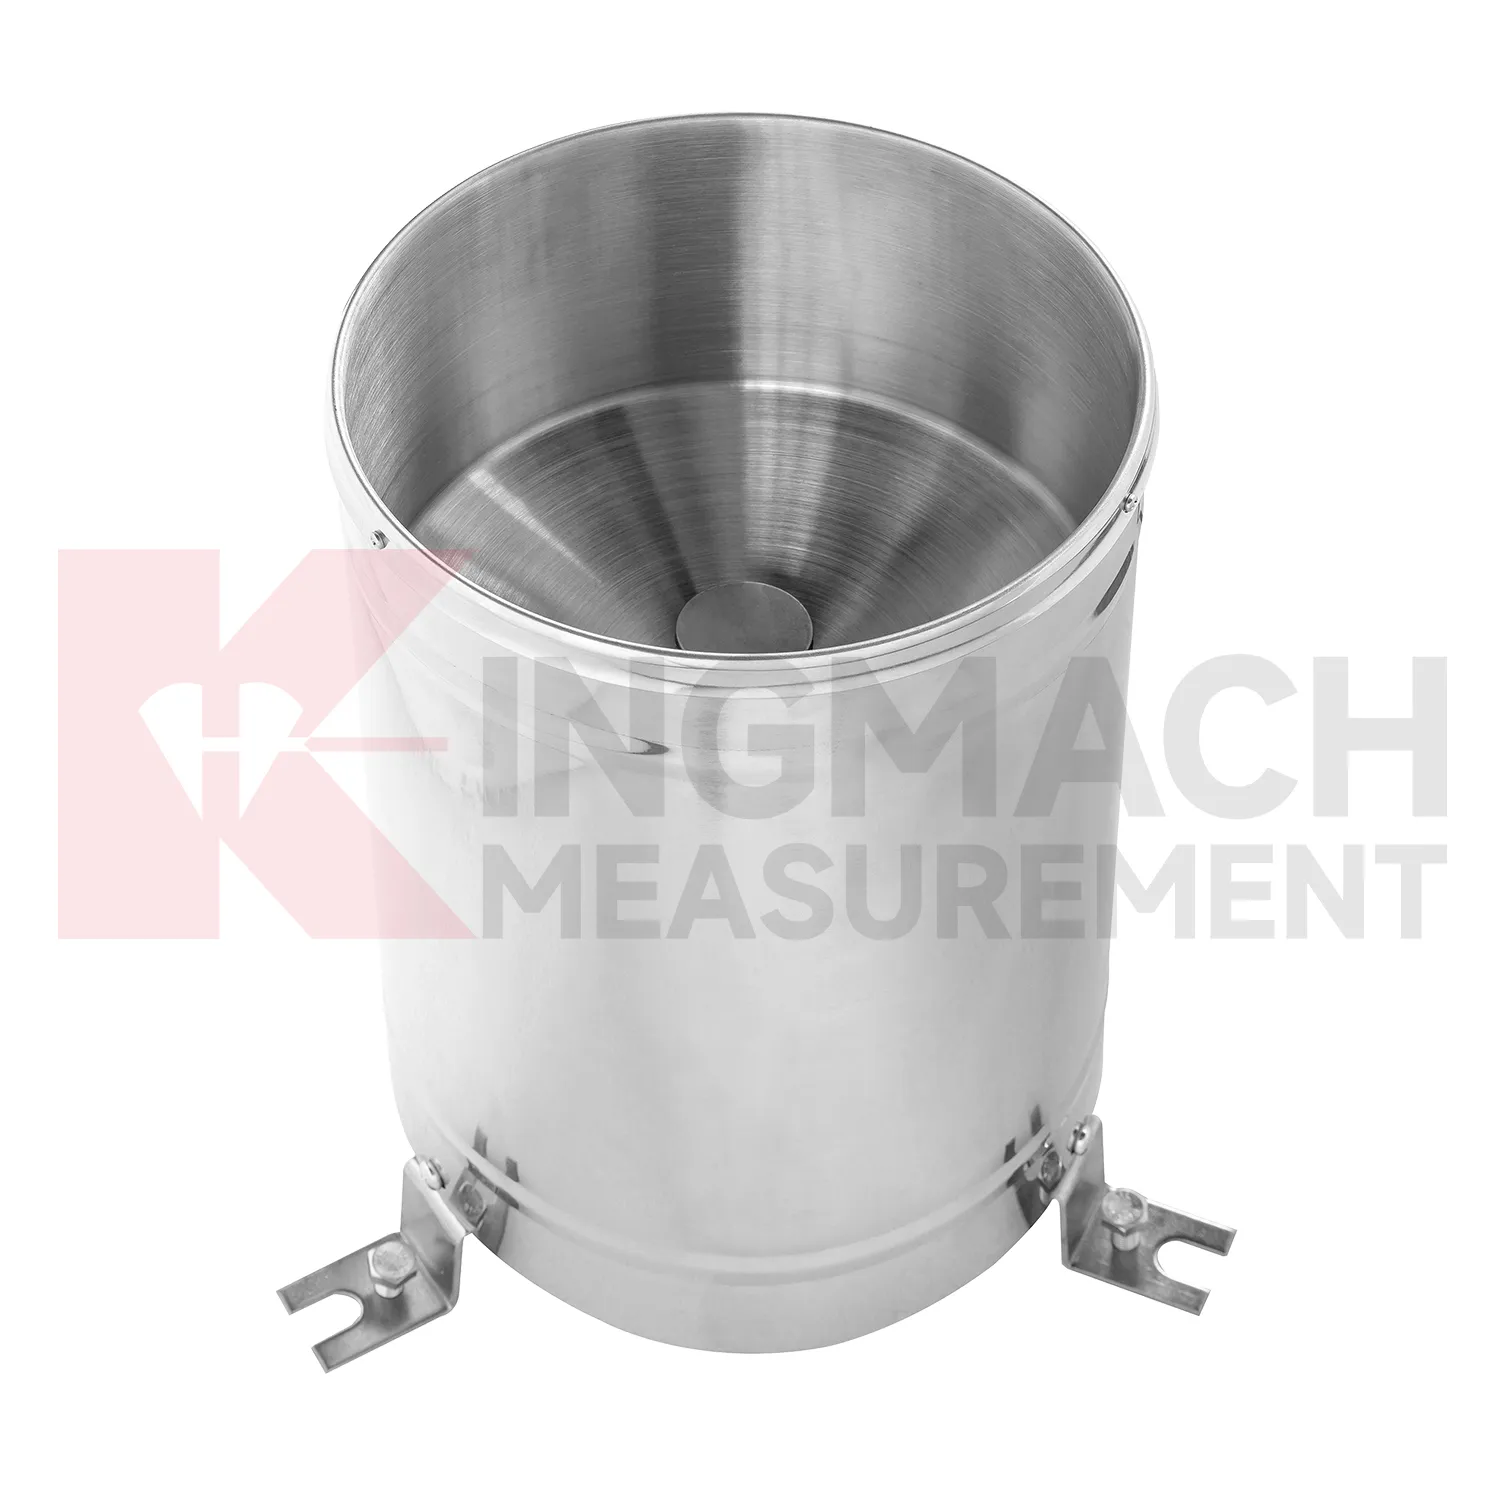
rain gauge tipping bucket
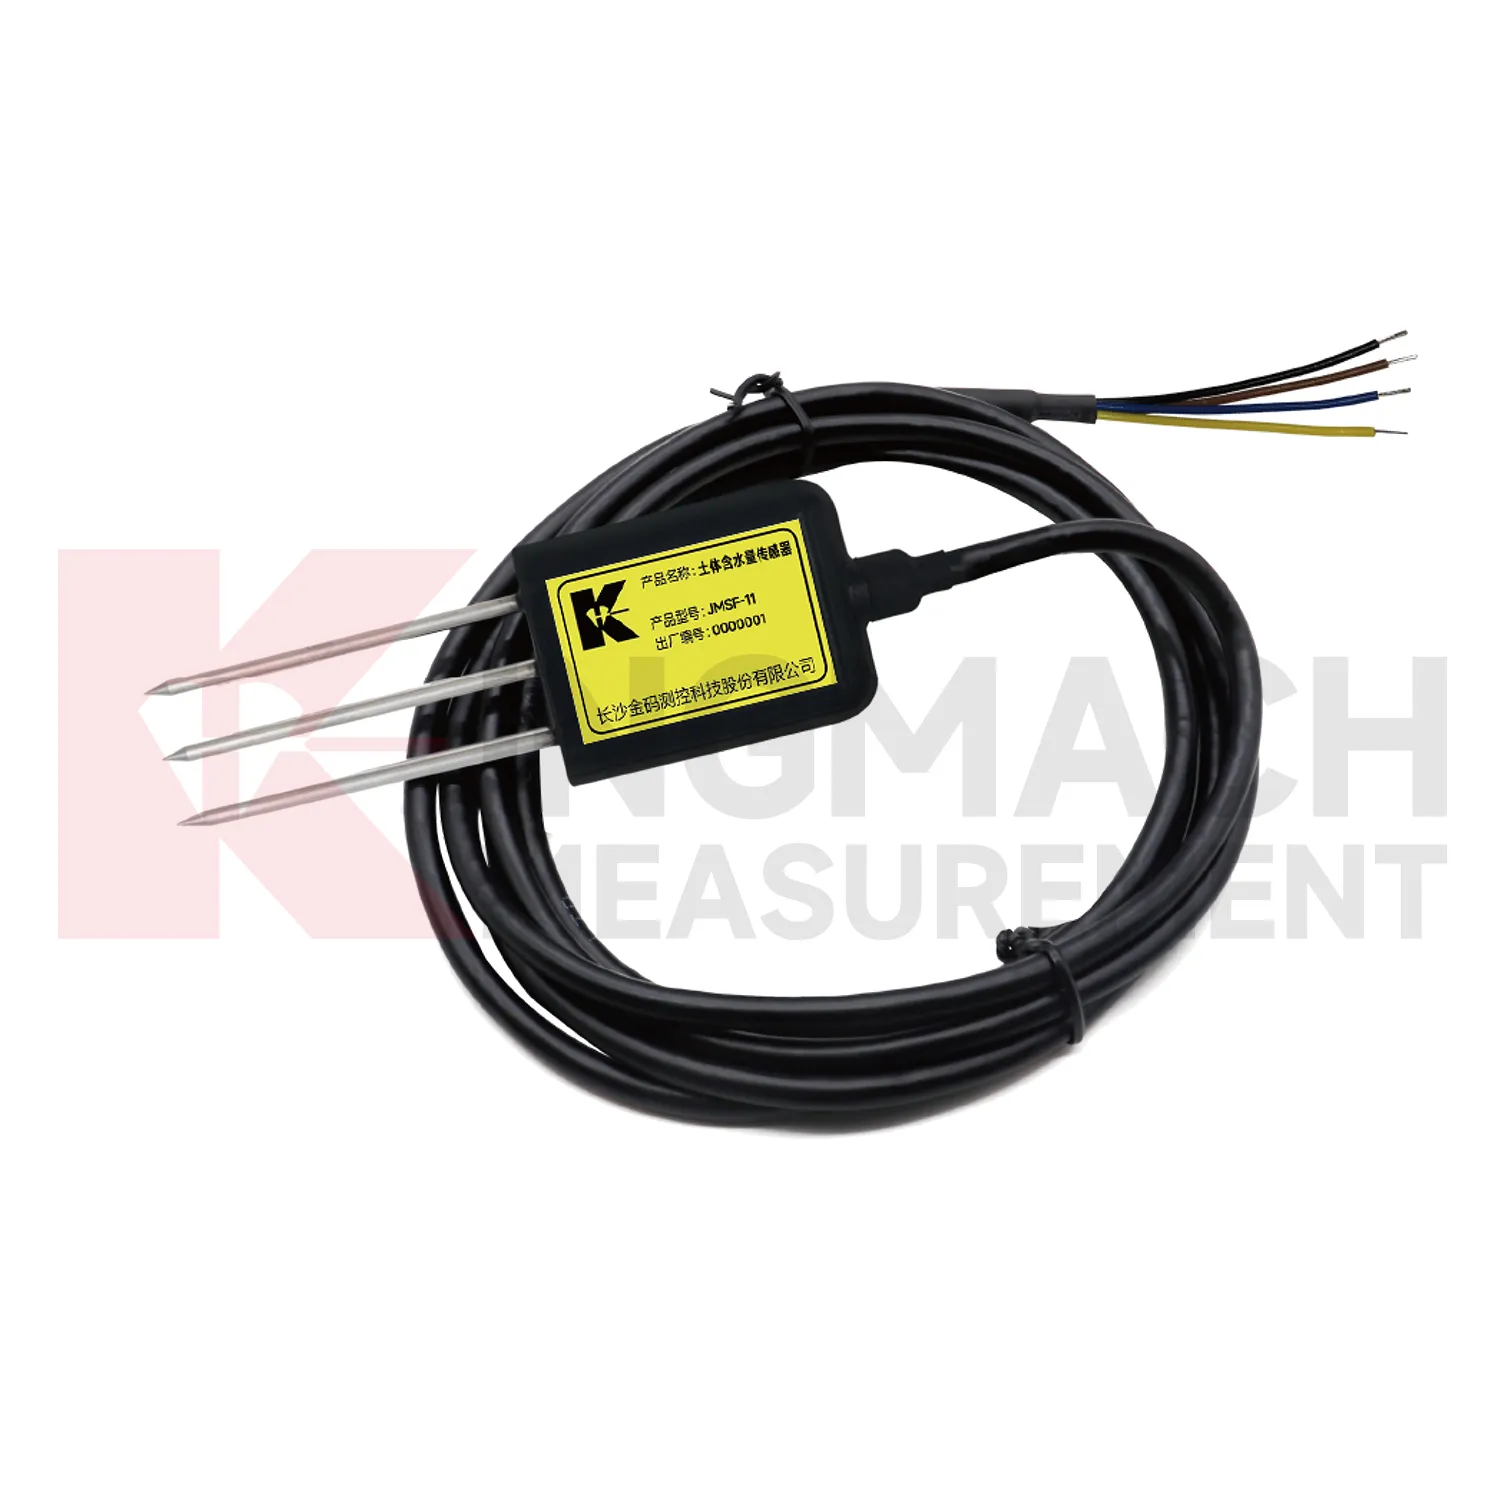
Soil-condition monitoring in Kingmach rain gauge tipping bucket is about understanding what happens below the visible surface. Rainfall may be measured at the ground surface, but the engineering risk often depends on whether water enters the soil body, how deep it travels, and how long the wet condition remains. A buried moisture point can help connect weather, irrigation, drainage, groundwater, and deformation. This matters for slopes, embankments, reclamation areas, greenhouses, hydraulic works, and agricultural sites. The important field details are probe depth, soil contact, cable protection, soil type, and the nearby structural or geotechnical points that will be reviewed with it. If moisture rises at the same time a displacement rate increases, the relation is worth investigation. If the soil dries while movement continues, the team may need to look for excavation, loading, seepage, or structural causes. The value is comparative interpretation, not an isolated moisture value.
A good review habit is to compare the condition channel with the nearest asset behavior instead of reading it as a standalone weather value. That keeps the record tied to slope movement, bridge response, tunnel equipment, dam seepage, drainage behavior, or cabinet reliability.
The installation file should explain why the location represents the monitored area. If the point is sheltered, shaded, exposed, buried, elevated, or placed inside an enclosure, that fact changes how later readings should be understood by maintenance staff.
Application of rain gauge tipping bucket
Integrated monitoring platforms use Kingmach rain gauge tipping bucket as the condition layer beside structural instruments. A platform should not display environmental values as decoration. Each channel should support a review path: rainfall for slope and seepage behavior, wind for bridge and tower response, temperature for strain and expansion, humidity for cabinet reliability, pressure for airflow or wind load, and soil wetness for ground movement. Setup should define units, time alignment, alarm review, linked structural channels, and maintenance responsibilities. During an abnormal event, the reviewer should be able to compare the condition change with structural response without opening separate files. That is how environmental data becomes useful in daily operation, emergency review, and long-term asset management.
Platform design should group channels by risk rather than by instrument type. A bridge wind group, slope rainfall group, tunnel humidity group, or dam seepage group is easier for field staff to understand than a long list of unrelated values. This grouping also helps alarm review because the relevant condition and response appear together.
Permission and reporting workflows matter too. Designers may need detailed curves, maintenance staff may need station status, and owners may need a plain event summary. A well-organized platform lets each user see the environmental context needed for their decision.
The future of rain gauge tipping bucket
The future of Kingmach rain gauge tipping bucket will focus on linking environmental triggers directly to structural behavior. Owners do not only need to know that rain fell, wind rose, or humidity changed. They need to know whether those conditions explain movement, strain, vibration, seepage, or equipment faults. Future monitoring reports should place condition curves and structural curves on the same timeline with inspection notes. That will make it easier to distinguish weather-driven behavior from progressive deterioration. The practical improvement is not more scattered data; it is clearer relationships. When environmental records are connected to the assets they affect, engineers can review alarms faster and plan field checks with better evidence.
This direction will also change how warning levels are written. A slope warning may depend on rainfall history and wetting trend, while a bridge warning may depend on wind period and structural response. Future systems should allow these links to be visible instead of forcing every channel into one isolated threshold.
For owners, the benefit is a shorter path from alarm to action. A reviewer can see the condition that changed, the asset that reacted, the inspection that followed, and whether the response returned to normal. That is more useful than separate charts that require manual reconstruction.
Care & Maintenance of rain gauge tipping bucket
Rainfall maintenance for Kingmach rain gauge tipping bucket should focus on keeping the catchment path clean and level. Leaves, dust, insects, scale, bird droppings, splash, and tilted mounting can distort rainfall records. The rain point should be inspected after storms, long dry periods, nearby earthwork, and seasonal debris build-up. Cleaning should be logged with date, condition, leveling status, and the first normal reading after work. Rainfall data is often used to explain slope movement, seepage, tunnel leakage, construction delay, or drainage performance. If the rain record is wrong, the engineering interpretation may also be wrong. Simple field care protects a much larger monitoring decision.
Maintenance teams should record cleaning, access difficulty, enclosure condition, cable repair, vegetation growth, nearby equipment changes, and the first normal reading after work. Those notes protect the meaning of the curve when old data is reviewed months later.
The environmental point should be part of a named monitoring question. It may explain wetting, drying, wind exposure, thermal movement, cabinet stress, or pressure variation, but that purpose needs to be visible in drawings and reports.
Kingmach rain gauge tipping bucket
A strong Kingmach rain gauge tipping bucket plan keeps the writing and the system focused on site conditions rather than product lists. The page should help a reader understand how weather, moisture, pressure, temperature, and humidity affect the assets they are responsible for. It should explain how environmental readings support slope review, bridge response, tunnel operation, dam inspection, irrigation control, construction records, and long-term maintenance. It should not read like a catalog of devices or a compressed specification table. The buyer needs a monitoring approach that connects field conditions with engineering decisions. That approach is what makes environmental data worth collecting over months and years.
Maintenance teams should record cleaning, access difficulty, enclosure condition, cable repair, vegetation growth, nearby equipment changes, and the first normal reading after work. Those notes protect the meaning of the curve when old data is reviewed months later.
The environmental point should be part of a named monitoring question. It may explain wetting, drying, wind exposure, thermal movement, cabinet stress, or pressure variation, but that purpose needs to be visible in drawings and reports.
FAQ
Q: Can environmental data support asset management?
A: Yes. Long-term records help owners compare weather, exposure, maintenance events, and structural response across seasons and assets.
Q: How does it help during alarms?
A: It lets reviewers check whether a structural alarm followed rain, wind, temperature change, humidity rise, or another site condition.
Q: What should dashboards show?
A: Dashboards should link environmental channels to the structural risks they explain, rather than displaying unrelated values together.
Q: Why avoid product-list writing?
A: Readers need to understand monitoring purpose and field value; long product lists make the page harder to use and less natural.
Q: What is the best review habit?
A: Review environmental data with time-aligned structural readings, inspection notes, maintenance records, and the site event that triggered concern.
If the reading seems unusual, the team should check the physical condition of the station before drawing conclusions about the asset. Blockage, poor exposure, loose wiring, water entry, and changed surroundings can all create misleading patterns.
Reviews
James Thompson
The tiltmeters and accelerometers are very sensitive and provide precise data. Perfect for our structural health monitoring system.
Andrew Lee
The visualization software is intuitive and powerful. It helps us analyze monitoring data efficiently.
Latest Inquiries
To protect the privacy of our buyers, only public service email domains like Gmail, Yahoo, and MSN will be displayed. Additionally, only a limited portion of the inquiry content will be shown.
Mia***@gmail.comNetherlands
Dear team, we are interested in your readouts & data loggers compatible with multiple sensors. Do yo...
Emma***@gmail.comCanada
Dear Sir/Madam, we are interested in displacement transducers and settlement sensors for a geotechni...
Related product categories
- resistance of temperature sensor
- Temperature and Humidity Acquisition Module
- water temperature sensor resistance
- soil moisture sensor
- soil moisture sensors
- capacitive soil moisture sensor
- best soil moisture sensor
- capacitive soil moisture sensors
- sensor soil moisture
- soil moisture sensor reviews
- capacitive soil moisture sensor v1 2
- resistive soil moisture sensor