
 EN
EN
 ar
ar bg
bg hr
hr cs
cs da
da nl
nl fi
fi fr
fr de
de el
el hi
hi it
it ko
ko no
no pl
pl pt
pt ro
ro ru
ru es
es sv
sv tl
tl iw
iw id
id lv
lv lt
lt sr
sr sk
sk sl
sl uk
uk vi
vi et
et hu
hu th
th tr
tr fa
fa ms
ms hy
hy ka
ka ur
ur bn
bn mn
mn ta
ta kk
kk uz
uz ku
ku
temperature sensor resistance
A handover-ready Kingmach temperature sensor resistance record should explain how environmental conditions were measured and why each point exists. It should include point location, measured condition, installation photo, cable route, power source, data channel, unit, first stable reading, maintenance access, and linked structural records. This matters because environmental stations often remain useful after the construction team leaves. A later owner may need to understand whether a slope moved after rainfall, whether a bridge vibrated during wind, or whether a cabinet failed after humidity rose. Without a clear handover record, those questions become guesswork. With one, the environmental record becomes part of long-term asset management, supporting maintenance budgets, inspection planning, and abnormal-event review.
For field teams, this point is most useful when the record shows the condition before the structural response, during the response, and after the site returns to routine operation. The note should include weather timing, inspection access, nearby construction, and whether the linked structural points changed in the same period.
A good review habit is to compare the condition channel with the nearest asset behavior instead of reading it as a standalone weather value. That keeps the record tied to slope movement, bridge response, tunnel equipment, dam seepage, drainage behavior, or cabinet reliability.
The installation file should explain why the location represents the monitored area. If the point is sheltered, shaded, exposed, buried, elevated, or placed inside an enclosure, that fact changes how later readings should be understood by maintenance staff.
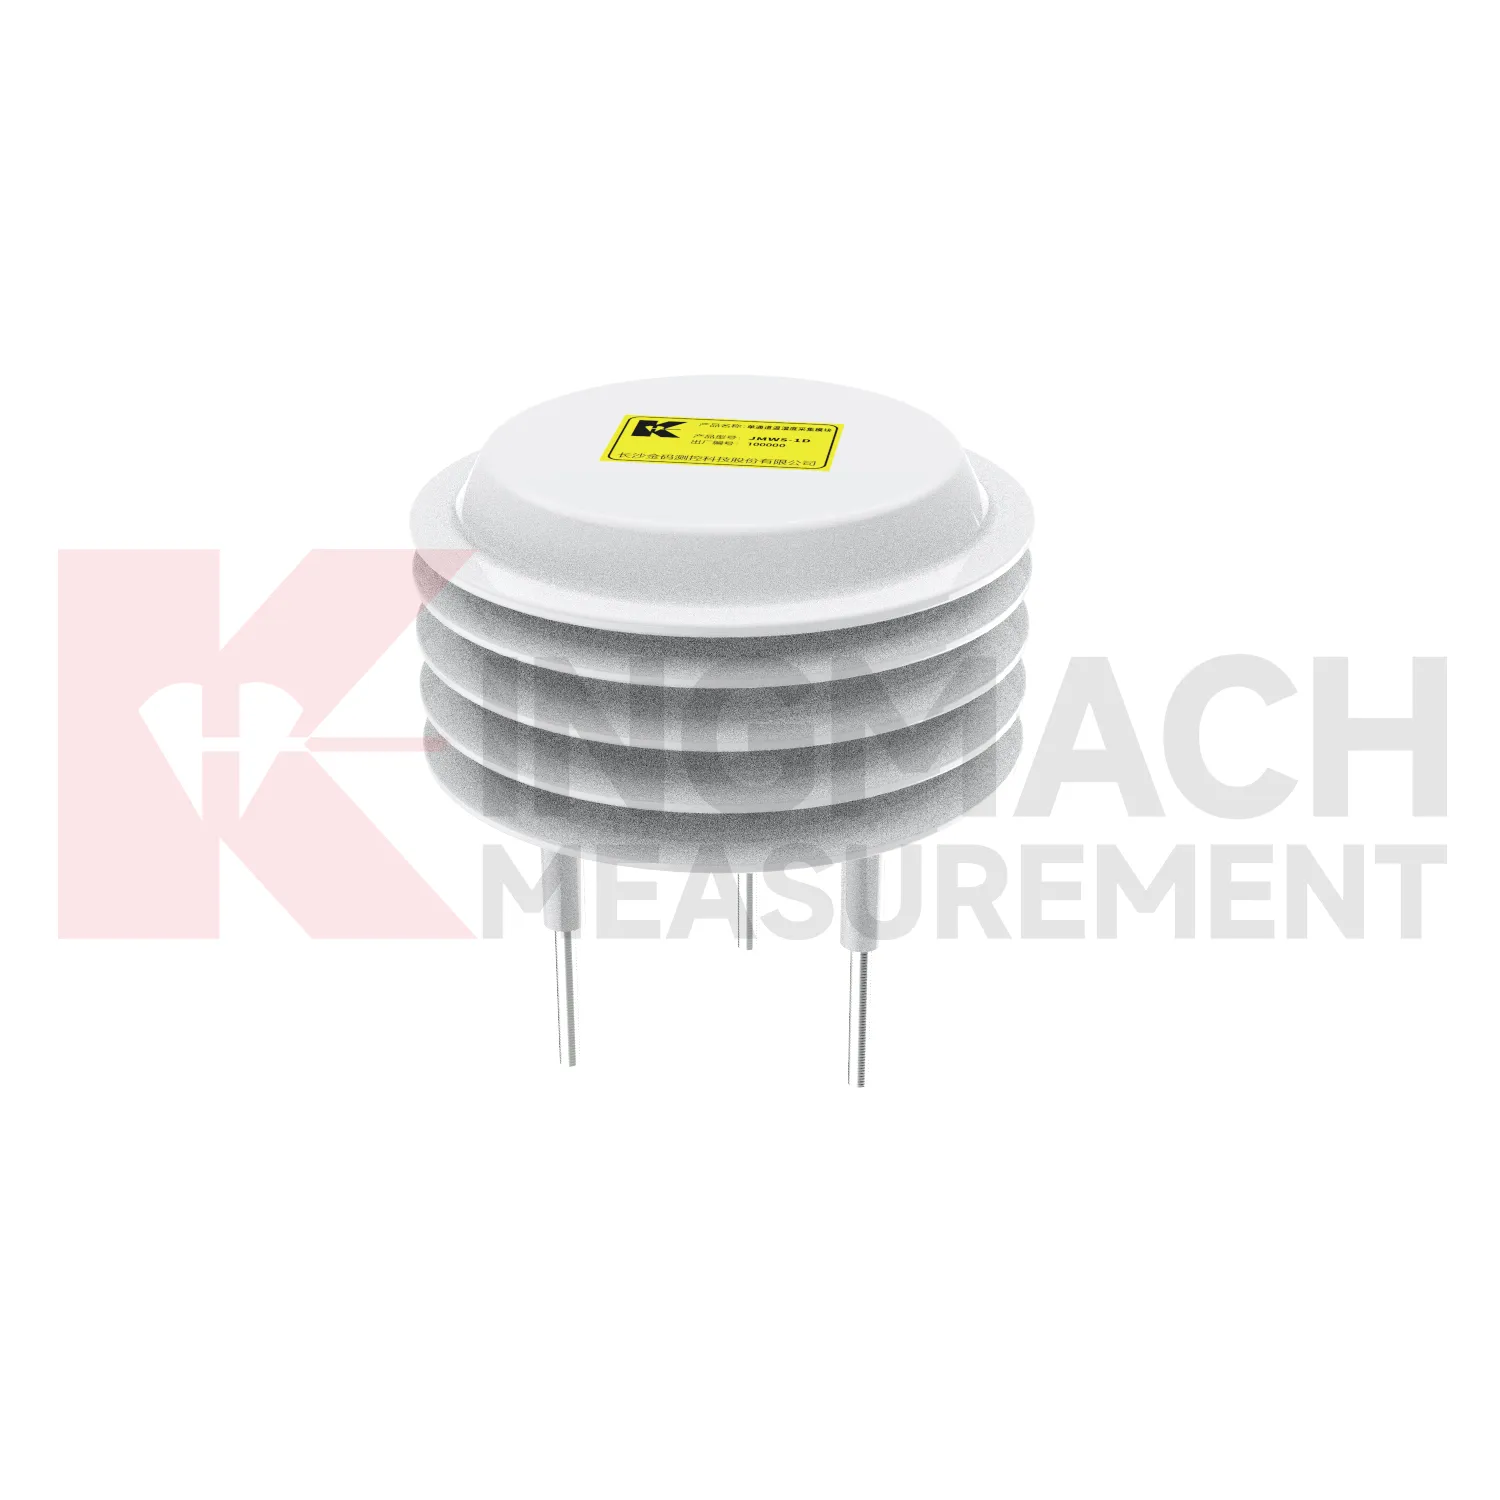
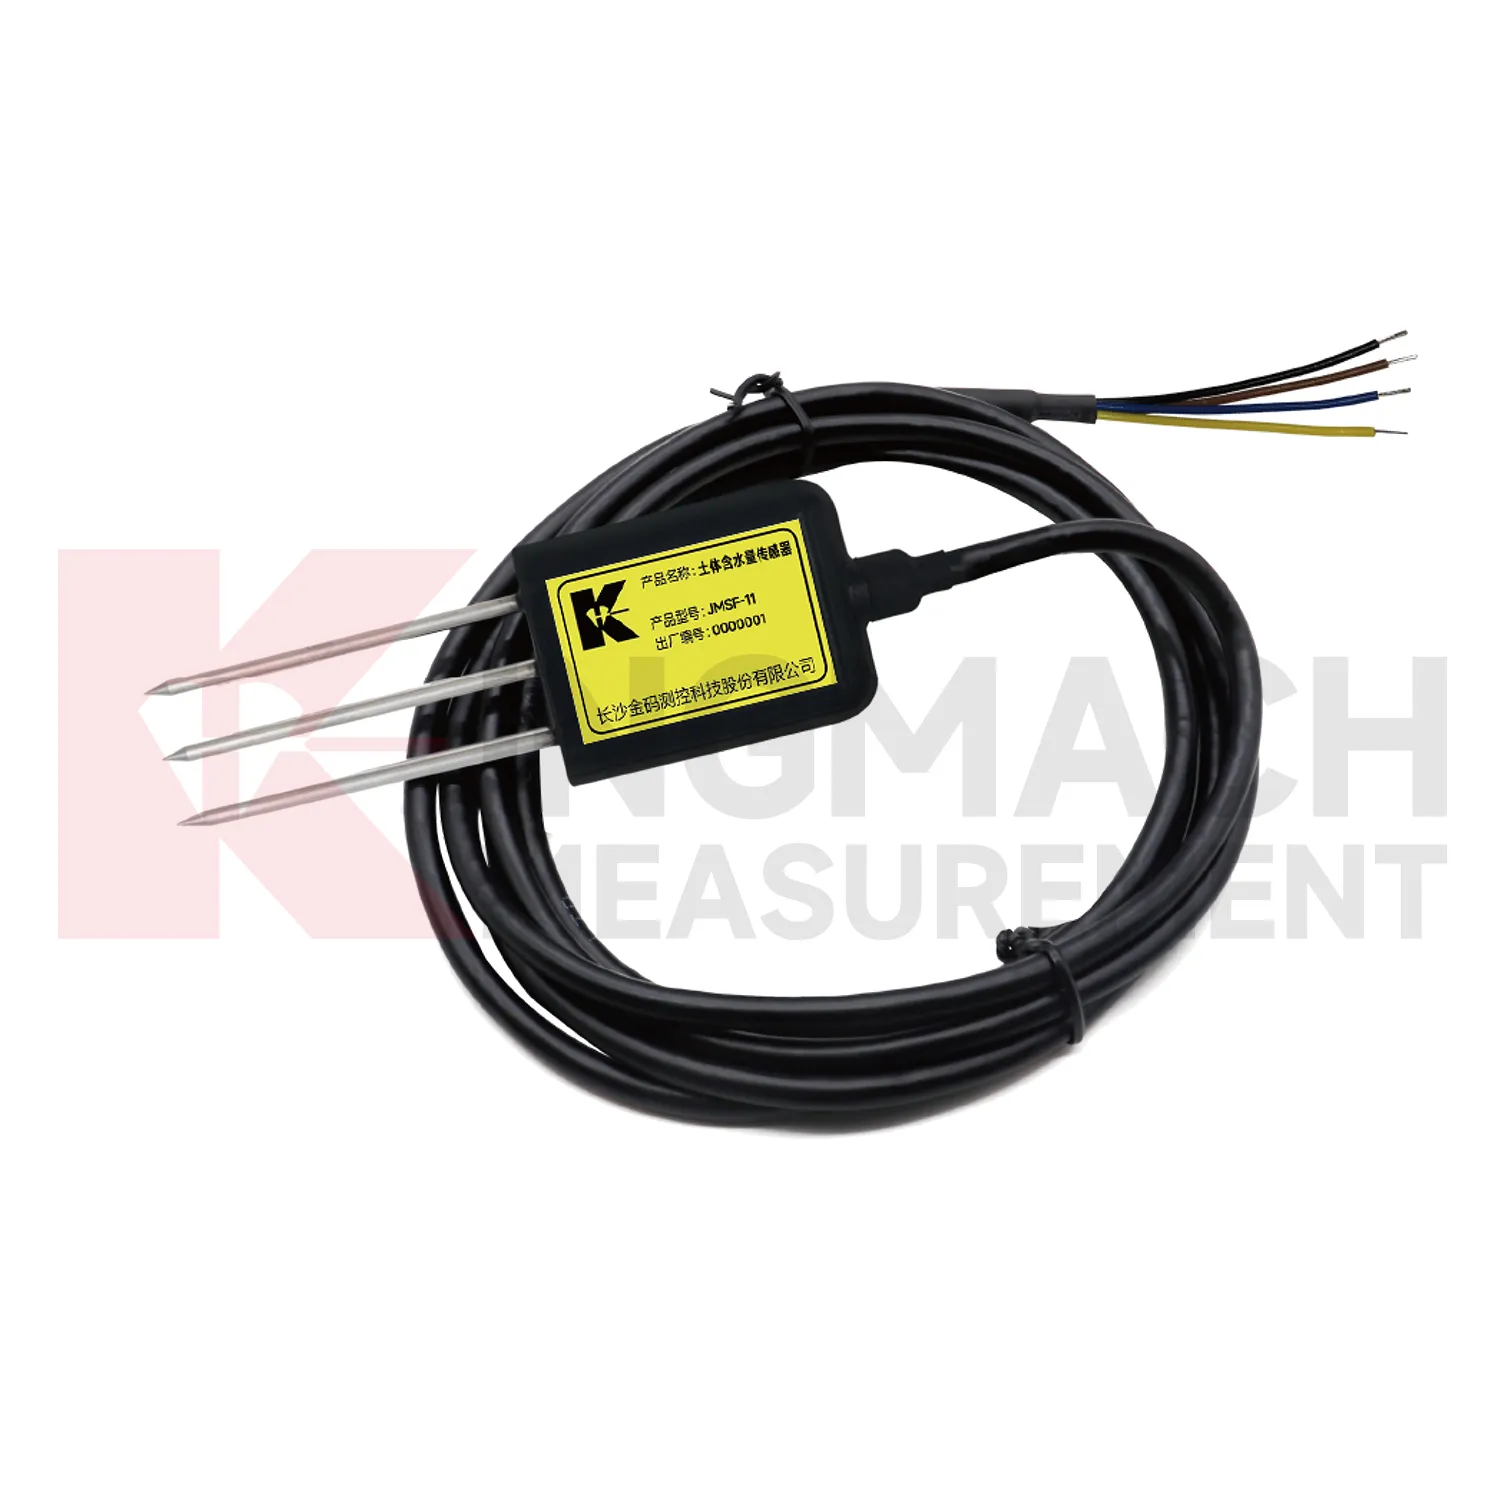
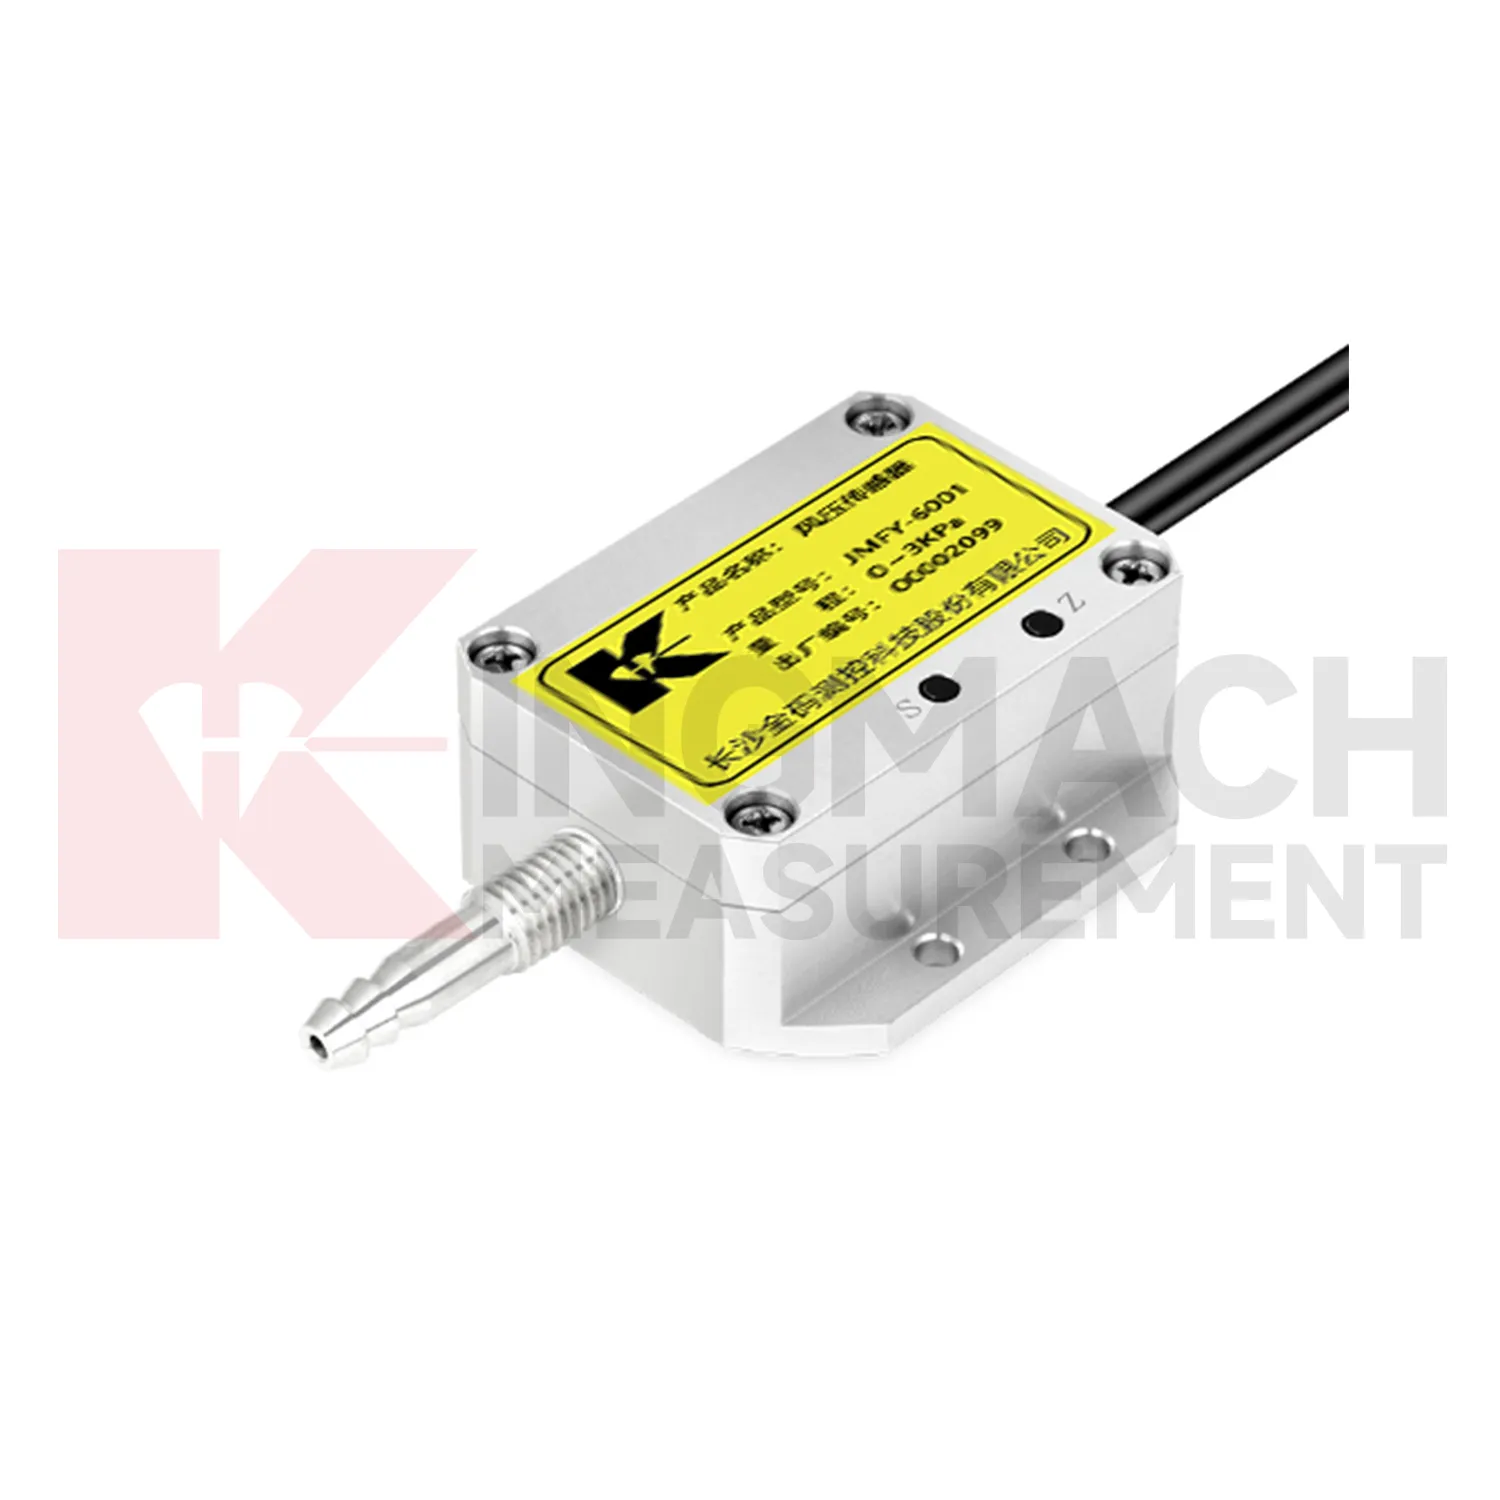
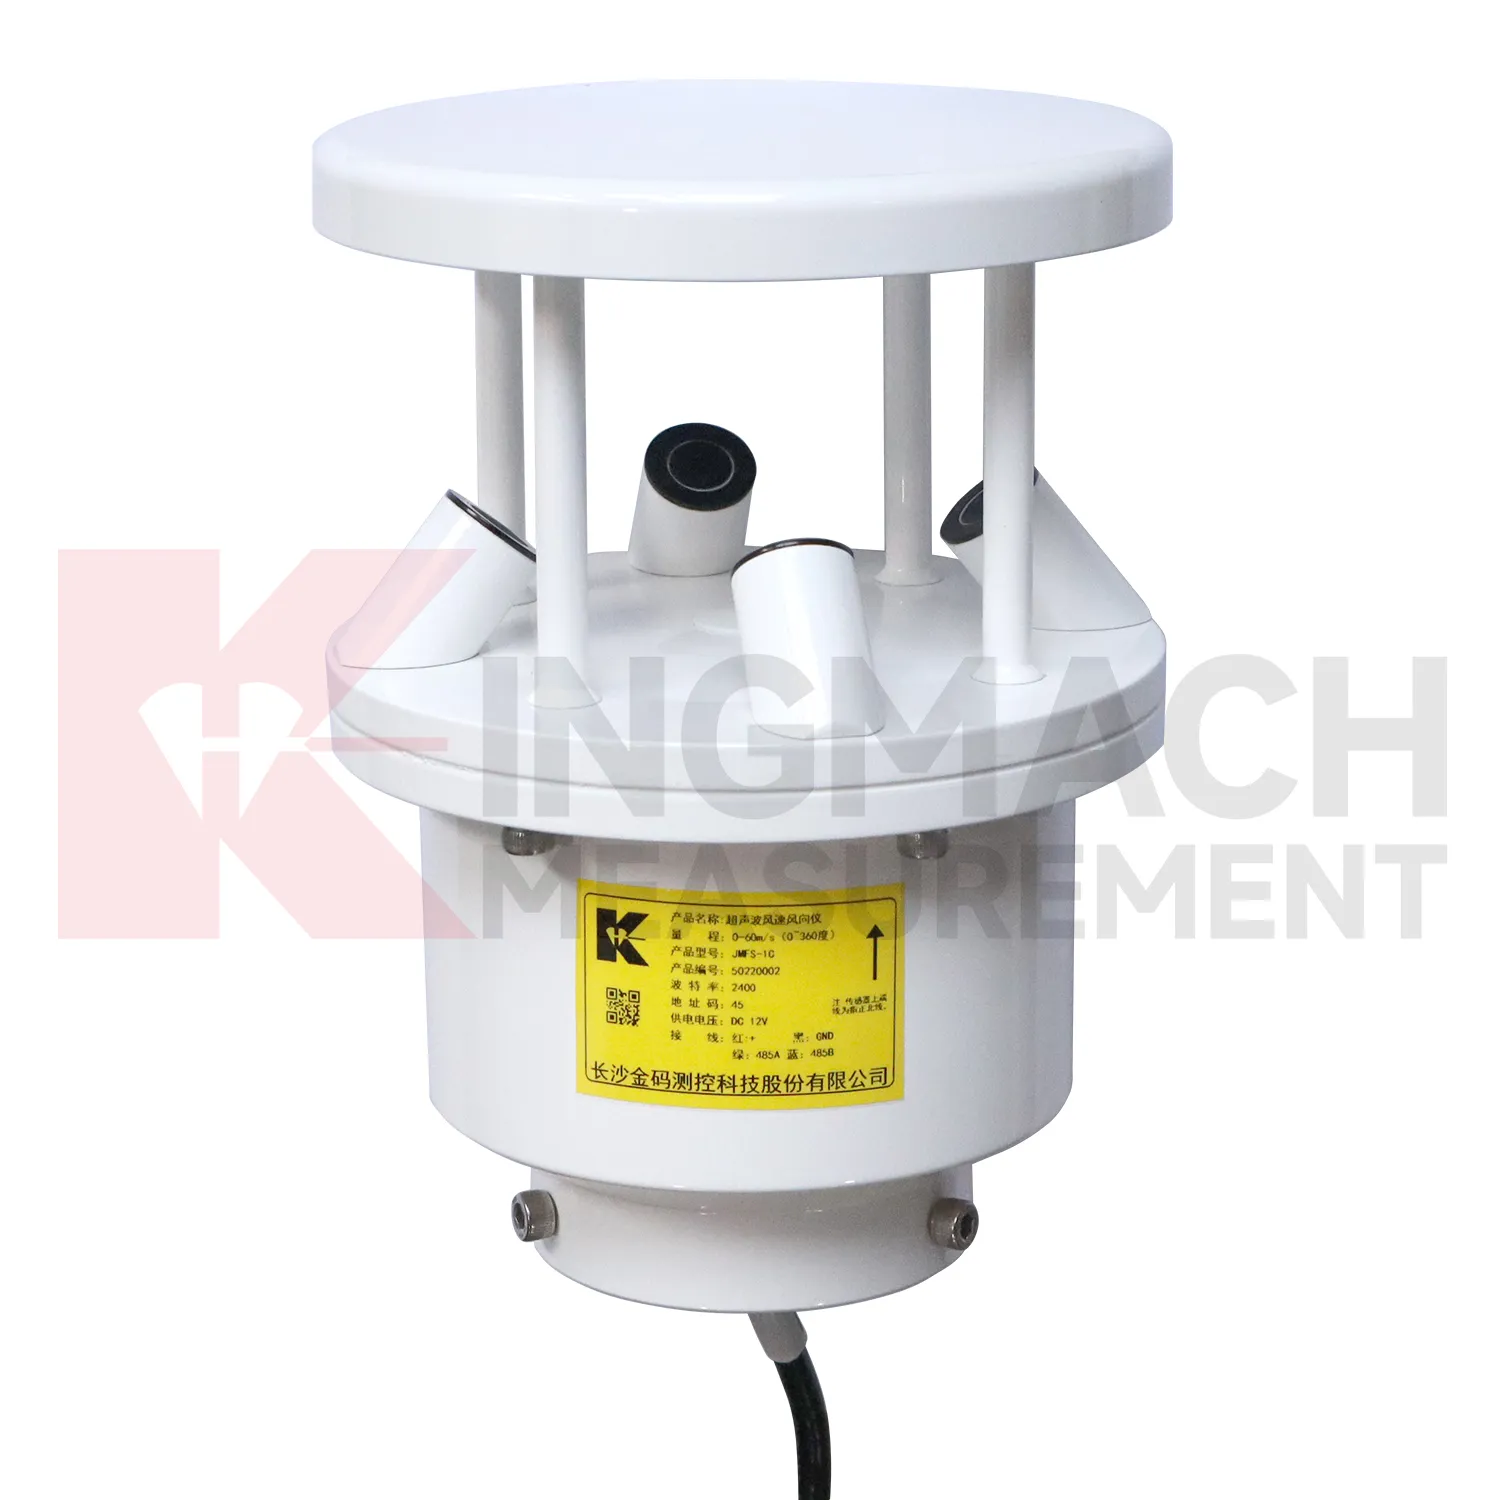
Application of temperature sensor resistance
Wind towers and tall structures use Kingmach temperature sensor resistance to compare exposure with structural behavior and maintenance needs. Wind, temperature, humidity, and pressure conditions can influence vibration, tilt, access decisions, cable routing, and enclosure life. An environmental station should avoid local shielding where possible and should be mounted with stable hardware that will not create its own movement. The record is useful when reviewed with acceleration, tilt, strain, foundation settlement, and maintenance events. If a tower shows unusual motion, the team can check whether the timing matches wind direction, gust activity, equipment operation, or service work. Long-term environmental records also help plan inspections after severe weather, icing, salt exposure, or repeated high-wind periods.
A good review habit is to compare the condition channel with the nearest asset behavior instead of reading it as a standalone weather value. That keeps the record tied to slope movement, bridge response, tunnel equipment, dam seepage, drainage behavior, or cabinet reliability.
The installation file should explain why the location represents the monitored area. If the point is sheltered, shaded, exposed, buried, elevated, or placed inside an enclosure, that fact changes how later readings should be understood by maintenance staff.
During abnormal events, the first question is not only whether the value crossed a limit. The reviewer should ask what changed around the site, whether the related structure reacted, and whether a field inspection confirmed the same pattern.
The future of temperature sensor resistance
Climate exposure will influence future Kingmach temperature sensor resistance requirements. Infrastructure owners increasingly face heat, heavy rain, high humidity, strong wind, ice, corrosion, and rapid weather changes. Monitoring stations must remain useful through those conditions, not only measure them. Future specifications should pay attention to enclosure access, cleaning needs, cable aging, connector protection, mounting stability, and weather-event history. Long-term records can help owners see whether repeated exposure affects an asset or the monitoring station itself. The future of environmental measurement is therefore both about recording the environment and keeping the record reliable while the environment is harsh.
If the reading seems unusual, the team should check the physical condition of the station before drawing conclusions about the asset. Blockage, poor exposure, loose wiring, water entry, and changed surroundings can all create misleading patterns.
A practical report links the condition value with time, place, and action. It should help a reviewer decide whether to keep observing, inspect the field point, compare nearby instruments, or record the event as normal site behavior.
Care & Maintenance of temperature sensor resistance
Temperature and humidity maintenance for Kingmach temperature sensor resistance should preserve the meaning of the measured environment. A point near a heater, vent, dripping pipe, open door, direct sun patch, or unrelated cabinet may not represent the target area. Inspect sensor position, dust, condensation, cable strain, cabinet sealing, and ventilation changes. If a temperature or humidity curve changes abruptly, check whether equipment operation, airflow, water entry, or maintenance work changed at the same time. Air-condition records are especially useful in tunnels, subways, factories, mines, shopping areas, construction rooms, and equipment enclosures. Careful placement and notes keep the record tied to the actual environment.
For owners, the strongest record is the one that remains understandable after staff changes. Clear units, plain point names, installation photos, maintenance notes, and linked structural channels make the data usable beyond the original project team.
For field teams, this point is most useful when the record shows the condition before the structural response, during the response, and after the site returns to routine operation. The note should include weather timing, inspection access, nearby construction, and whether the linked structural points changed in the same period.
Kingmach temperature sensor resistance
The data chain behind Kingmach temperature sensor resistance should be as clear as the sensors themselves. Environmental channels may use different signal types, units, update intervals, and power needs. If the channel names are weak, a report may confuse rainfall with another station, wind direction with wind speed, or room humidity with cabinet humidity. Each point should have a unit, location, data path, inspection interval, and linked structural record. This prevents environmental data from being collected but ignored. During an alarm, the team should be able to open one timeline and see the condition change, the structural response, and the maintenance note. That is where environmental monitoring becomes practical.
During abnormal events, the first question is not only whether the value crossed a limit. The reviewer should ask what changed around the site, whether the related structure reacted, and whether a field inspection confirmed the same pattern.
Long-term value comes from consistency. A channel that keeps the same location, unit, maintenance history, and linked asset record can support seasonal comparison, post-storm review, and handover between construction and operation teams.
FAQ
Q: Where should a rain point be placed?
A: It should be level, open to the sky, and away from obstructions, splash sources, roof edges, and debris-prone areas.
Q: Where should wind be measured?
A: Wind should be measured where airflow represents the asset or work area being reviewed, not behind a wall or sheltered obstruction.
Q: How should soil points be installed?
A: They should have firm contact with the surrounding soil, a recorded depth, protected cable route, and a stable first value.
Q: What should commissioning records include?
A: Include point location, measured condition, unit, mounting photo, cable route, power source, data channel, and linked structural record.
Q: Why are photos useful?
A: Photos help future reviewers understand exposure, mounting, cable routing, and whether later site changes affected readings.
Maintenance teams should record cleaning, access difficulty, enclosure condition, cable repair, vegetation growth, nearby equipment changes, and the first normal reading after work. Those notes protect the meaning of the curve when old data is reviewed months later.
Reviews
Michael Anderson
The strain gauges and load cells are extremely accurate and stable. They performed very well in our bridge monitoring project. Highly recommended!
Daniel Brown
Excellent environmental monitoring sensors. The data is consistent, and the system integrates smoothly with our existing setup.
Latest Inquiries
To protect the privacy of our buyers, only public service email domains like Gmail, Yahoo, and MSN will be displayed. Additionally, only a limited portion of the inquiry content will be shown.
Harper***@gmail.comIndia
Dear Sir, we are planning to procure a complete monitoring system including strain gauges, tiltmeter...
Mia***@gmail.comNetherlands
Dear team, we are interested in your readouts & data loggers compatible with multiple sensors. Do yo...
Related product categories
- tipping bucket rain gauge 0.2 mm resolution standard
- tipping bucket rain gauge data logger
- tipping bucket rain gauge resolution 0.1 mm typical
- tipping bucket rain gauge resolution 0.2 mm typical
- tipping bucket rain gauge typical resolution 0.2 mm standard
- typical tipping bucket rain gauge resolution 0.2 mm standard
- Temperature Sensor
- Chain-type Temperature Sensor
- Temperature String
- Daisy-Chained Digital Thermometer
- Single-Channel Temperature and Humidity Acquisition Module
- Environmental Monitoring